import pandas as pd
%load_ext rpy2.ipython
%%R

library(ggplot2)
library(RColorBrewer)
library(ggpubr)
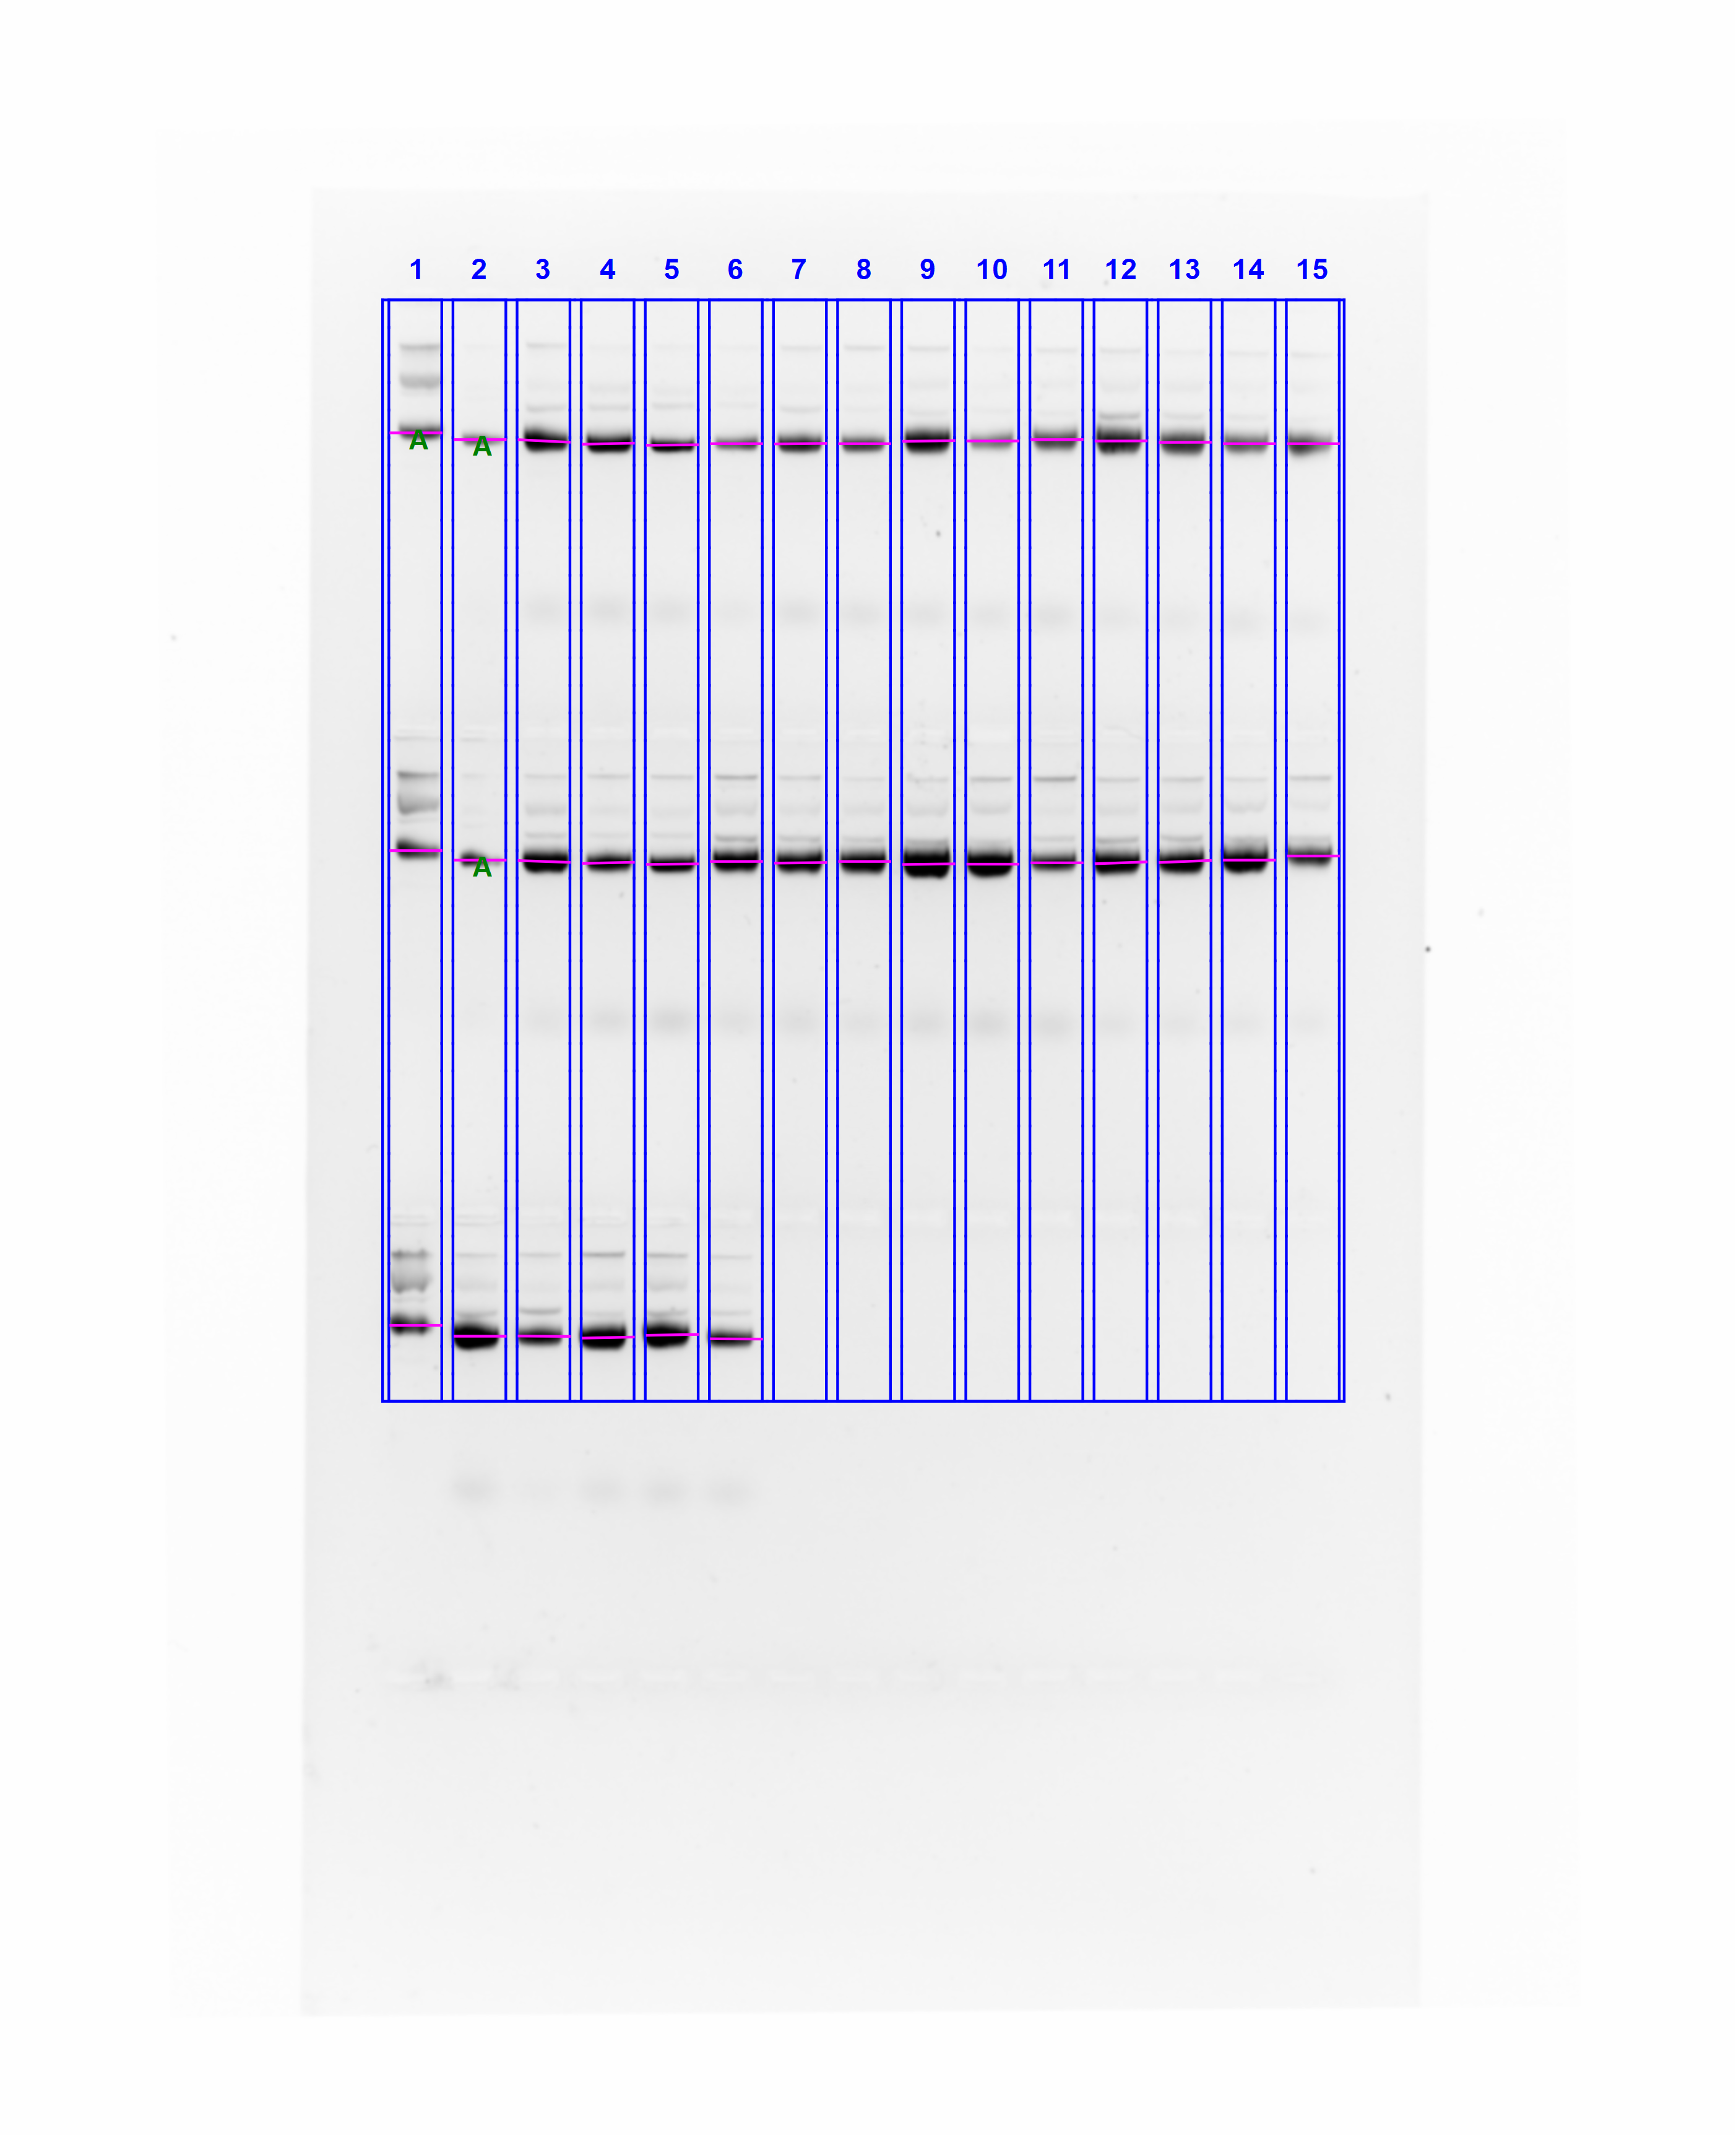
Gel run on 3/26/22

Read gel quantification.
df = pd.read_csv('2022-03-26_15h31m30s-T7Init-midi-preps-1ul-sanity-check.csv')
Remove pFC53 and pFC9 lanes
df = df.loc[~df['Band_Label'].isin(('pFC53', 'pFC9'))]
df = df.sort_values('insert_num')
Plot concentrations measured relative to pFC53 and pFC9 supercoiled bands.
%%R -i df -w 7 -h 5 --units in -r 200

barplot <- ggplot(df, aes(x=as.factor(insert_num), y=Abs.Quant.)) +
        geom_bar(
            stat='identity', color='black', fill='dodgerblue', position='dodge',
            width=0.70
        ) + theme_pubr() + coord_flip() +
        labs(y='Concentration (ng/ul)',
             x='Insert',
             title='T7Init Series midi preps concentration measurement by agarose gel') +
        theme(text = element_text(size = 8))

boxplot <- ggplot(df, aes(y=Abs.Quant.)) + geom_boxplot(fill='tan') + theme_pubr() +
            labs(y='Concentration (ng/ul)') +
            theme(axis.title.x=element_blank(),
                axis.text.x=element_blank(),
                axis.ticks.x=element_blank()
                 )

quant.plot <- ggarrange(barplot, boxplot, widths=c(1, 0.7))
quant.plot
%%R
ggsave(
    "2022-03-26_15h31m30s-T7Init-midi-preps-1ul-sanity-check.csv.quant.plot.png",
    quant.plot,
    dpi=300
)
R[write to console]: Saving 6.67 x 6.67 in image
Make spreadsheet describing volumes to add of each construct to create T7InitVRMix-1.
CON_PER_INSERT = 10  # ng / ul
TOTAL_VOLUME = 300  # ul

df['ul_add_to_mix'] = CON_PER_INSERT * TOTAL_VOLUME / df['Abs.Quant.']
mix = df[["Band_Label", 'ul_add_to_mix', "insert_num", "Abs.Quant."]]
mix = mix.sort_values('insert_num')

print(mix.to_markdown(index=False))
| Band_Label   |   ul_add_to_mix |   insert_num |   Abs.Quant. |
|:-------------|----------------:|-------------:|-------------:|
| VR1          |         3.15808 |            1 |      949.945 |
| VR2          |         3.37399 |            2 |      889.155 |
| VR3          |         4.68847 |            3 |      639.868 |
| VR4          |         7.74572 |            4 |      387.311 |
| VR5          |         4.35732 |            5 |      688.496 |
| VR6          |         5.69779 |            6 |      526.52  |
| VR7          |         2.84563 |            7 |     1054.25  |
| VR8          |         7.85345 |            8 |      381.998 |
| VR9          |         4.82521 |            9 |      621.734 |
| VR10         |         2.9479  |           10 |     1017.67  |
| VR11         |         3.71493 |           11 |      807.552 |
| VR12         |         5.94932 |           12 |      504.259 |
| VR13         |         5.44227 |           13 |      551.24  |
| VR14         |         2.75593 |           14 |     1088.56  |
| VR15         |         3.74733 |           15 |      800.571 |
| VR16         |         3.78123 |           16 |      793.392 |
| VR17         |         2.89164 |           17 |     1037.47  |
| VR18         |         3.02504 |           18 |      991.723 |
| VR19         |         2.89629 |           19 |     1035.81  |
| VR20         |         2.08432 |           20 |     1439.32  |
| VR21         |         2.35206 |           21 |     1275.48  |
| VR22         |         4.25264 |           22 |      705.444 |
| VR23         |         2.77091 |           23 |     1082.68  |
| VR24         |         2.86016 |           24 |     1048.89  |
| VR25         |         2.61526 |           25 |     1147.11  |
| VR26         |         4.16159 |           26 |      720.878 |
| VR27         |         2.47214 |           27 |     1213.52  |
| VR28         |         4.02208 |           28 |      745.883 |
| VR29         |         2.5868  |           29 |     1159.74  |
| VR30         |         2.61421 |           30 |     1147.57  |
| VR31         |         4.54334 |           31 |      660.307 |
print('Volume TE:', round(TOTAL_VOLUME-sum(mix['ul_add_to_mix']), 3))
Volume TE: 180.967
mix.to_csv('T7InitMix-1-construct-volumes.csv')
qu = pd.read_csv('QuBit-T7Measures3-3_26_28.csv')
qu.head()
| Insert | Dilution total volume | Measure 1 | Measure 2 | Measure 3 | Stock concentration | Fold Difference 3/4 measurements | |
|---|---|---|---|---|---|---|---|
| 0 | 1 | 400 | 0.534 | 0.520 | 0.513 | 208.933333 | -0.642849 |
| 1 | 2 | 400 | 0.622 | 0.606 | 0.603 | 244.133333 | -0.440061 |
| 2 | 3 | 400 | 0.434 | 0.426 | 0.420 | 170.666667 | -0.622419 |
| 3 | 4 | 400 | 0.283 | 0.268 | 0.268 | 109.200000 | -0.368786 |
| 4 | 5 | 400 | 3.600 | 3.560 | 3.540 | 1426.666667 | 3.919540 |
merge = pd.merge(mix, qu, left_on='insert_num', right_on='Insert')
merge.head()
| Band_Label | ul_add_to_mix | insert_num | Abs.Quant. | Insert | Dilution total volume | Measure 1 | Measure 2 | Measure 3 | Stock concentration | Fold Difference 3/4 measurements | |
|---|---|---|---|---|---|---|---|---|---|---|---|
| 0 | VR1 | 3.158078 | 1.0 | 949.944817 | 1 | 400 | 0.534 | 0.520 | 0.513 | 208.933333 | -0.642849 |
| 1 | VR2 | 3.373992 | 2.0 | 889.154508 | 2 | 400 | 0.622 | 0.606 | 0.603 | 244.133333 | -0.440061 |
| 2 | VR3 | 4.688466 | 3.0 | 639.868137 | 3 | 400 | 0.434 | 0.426 | 0.420 | 170.666667 | -0.622419 |
| 3 | VR4 | 7.745721 | 4.0 | 387.310637 | 4 | 400 | 0.283 | 0.268 | 0.268 | 109.200000 | -0.368786 |
| 4 | VR5 | 4.357324 | 5.0 | 688.495993 | 5 | 400 | 3.600 | 3.560 | 3.540 | 1426.666667 | 3.919540 |
merge['fold_change_gel_qubut'] = merge['Abs.Quant.'] / merge['Stock concentration'] - 1
%%R -i merge -w 7 -h 5 --units in -r 200

barplot.qu <- ggplot(merge, aes(x=as.factor(insert_num), y=fold_change_gel_qubut)) +
        geom_bar(
            stat='identity', color='black', fill='pink', position='dodge',
            width=0.70
        ) + theme_pubr() + coord_flip() +
        labs(y='Fold change',
             x='Insert',
             title='Fold change ') +
        theme(text = element_text(size = 8))

boxplot.qu <- ggplot(merge, aes(y=fold_change_gel_qubut)) + geom_boxplot(fill='lavender') + theme_pubr() +
            labs(y='Fold change agarose gel vs. QuBit quantification') +
            theme(axis.title.x=element_blank(),
                axis.text.x=element_blank(),
                axis.ticks.x=element_blank()
                 )

quant.plot.qu <- ggarrange(barplot.qu, boxplot.qu, widths=c(1, 0.7))
quant.plot.qu
%%R
ggsave(
    "2022-03-26_15h31m30s-T7Init-midi-preps-1ul-sanity-check.csv.quant.quBit.fold.change.plot.png",
    quant.plot.qu,
    dpi=300
)
R[write to console]: Saving 6.67 x 6.67 in image