Background #
After IVT and bisulfite conversion, samples are PCR amplified both to increase sample concentration for sequencing and to “repair” damage done by bisulfite treatment. In order to multiplex reactions on one PacBio SMRT-cell I designed primers for this PCR reaction with overhanging ends that contain barcode that can uniquely identify a reaction. In order to minimize the number of PCR cycles required to yield a suitable amount of DNA for library prep, ~5 ug, I will run an IVT reaction with T7Init mix and pFC9 as a positive control followed by non-denaturing bisulfite conversion using the Zymogen lightning DNA methylation kit. I will then use the bisulfite converted DNA to optimize number of PCR cycles for a subset of my barcoded forward primers and reverse primer (reverse primer is not barcoded and can be used with any forward primer).
IVT reaction and non-denaturing bisulfite conversion #
2/7/22 #
Sample description and reaction protocol #
Using pFC9 and T7Init Mix 0 I setup the IVT reaction described in this spreadsheet.
DNA template to T7 ratios where informed by the results of T7 for bisulfite IVT optimization results.
IVT sample description
Transcription Master Mix (all units ul)
| Total Volume | npH20 | 10X transcription mix | rNTPs | DTT | Substrate | MM name |
|---|---|---|---|---|---|---|
| 42.18749659 | 28.62577919 | 4.218749659 | 0.912 | 4.56 | 3.870967742 | T7Init MM |
| 42.18749659 | 31.05674693 | 4.218749659 | 0.912 | 4.56 | 1.44 | pFC9 MM |
Samples
| Sample Number | Master mix (ul) | Polymerase volume (ul) | npH20 (ul) | Reaction time (mins) | Incubation temp | Post rxn 0.5M EDTA | Mix Name |
|---|---|---|---|---|---|---|---|
| 1 | 17.57812358 | 1.421876422 | 0 | 20 | 37 | 1 | T7Init MM |
| 2 | 17.57812358 | 0 | 1.421876422 | 20 | 37 | 1 | T7Init MM |
| 3 | 17.57812358 | 1.421876422 | 0 | 20 | 37 | 1 | pFC9 MM |
| 4 | 17.57812358 | 0 | 1.421876422 | 20 | 37 | 1 | pFC9 MM |
Gloabl Reaction parameters
| Parameter | Value |
|---|---|
| Average template length | 3552 |
| Reaction Concentration (nM) | 11.22534017 |
| Target nM template / units Pol * 1e6 | 3 |
| rNTP Rxn Concentration (mM) | 0.5 |
| DTT Rxn Concentration (mM) | 10 |
Reagents
| Name | Cat | Lot |
|---|---|---|
| NEB T7 RNA Polymerase | MO251L | 10117895 |
| NEB 10x Transcription buffer | B90125 | 10073286 |
| NEB rNTPS | NO466S | 10085968 |
| Promega DTT | P117B | 38464 |
| Zymogen lightening conversion reagent | D5030-1 | 211521 |
Master mixes were made for each template and then T7 polymerase was added to transcribed samples and and equal volume of npH20 was added in leiu of T7 to untranscribed samples. All samples were incubated at 37C for 20 mins after which all samples were placed on ice and 1 ul of 0.5 M EDTA was added to stop transcription.
After adding EDTA I removed 4.2 ul (volume containing ~100 ng of template) to run on an agarose gel and added 0.5 ul 1:1000 RnaseA to these aliquots which were incubated at room temperature for 15 minutes before loading onto 0.8% 1x TBE agarose gel without EtBr.
I increased volume of the remaining samples back to 20 ul using npH20 and added 130 ul Zymogen lightening conversion reagent. I then placed samples in rotisserie at 37C with rotation for 2 hours. After completing incubation I continued with Zymogen lightening DNA protocol as provided by manufacturer. I then re-suspended samples in 20 ul TE and placed at -20C for later use.
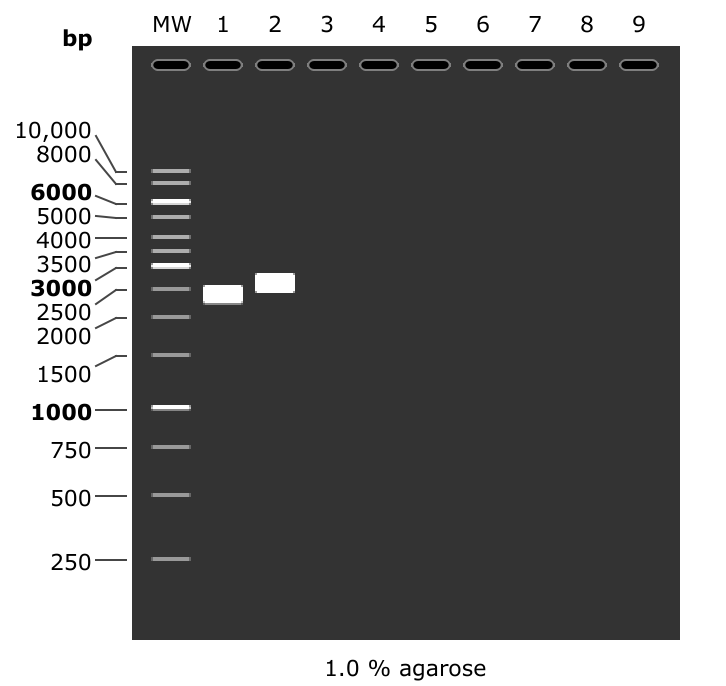
Agarose gel of transcription reaction #
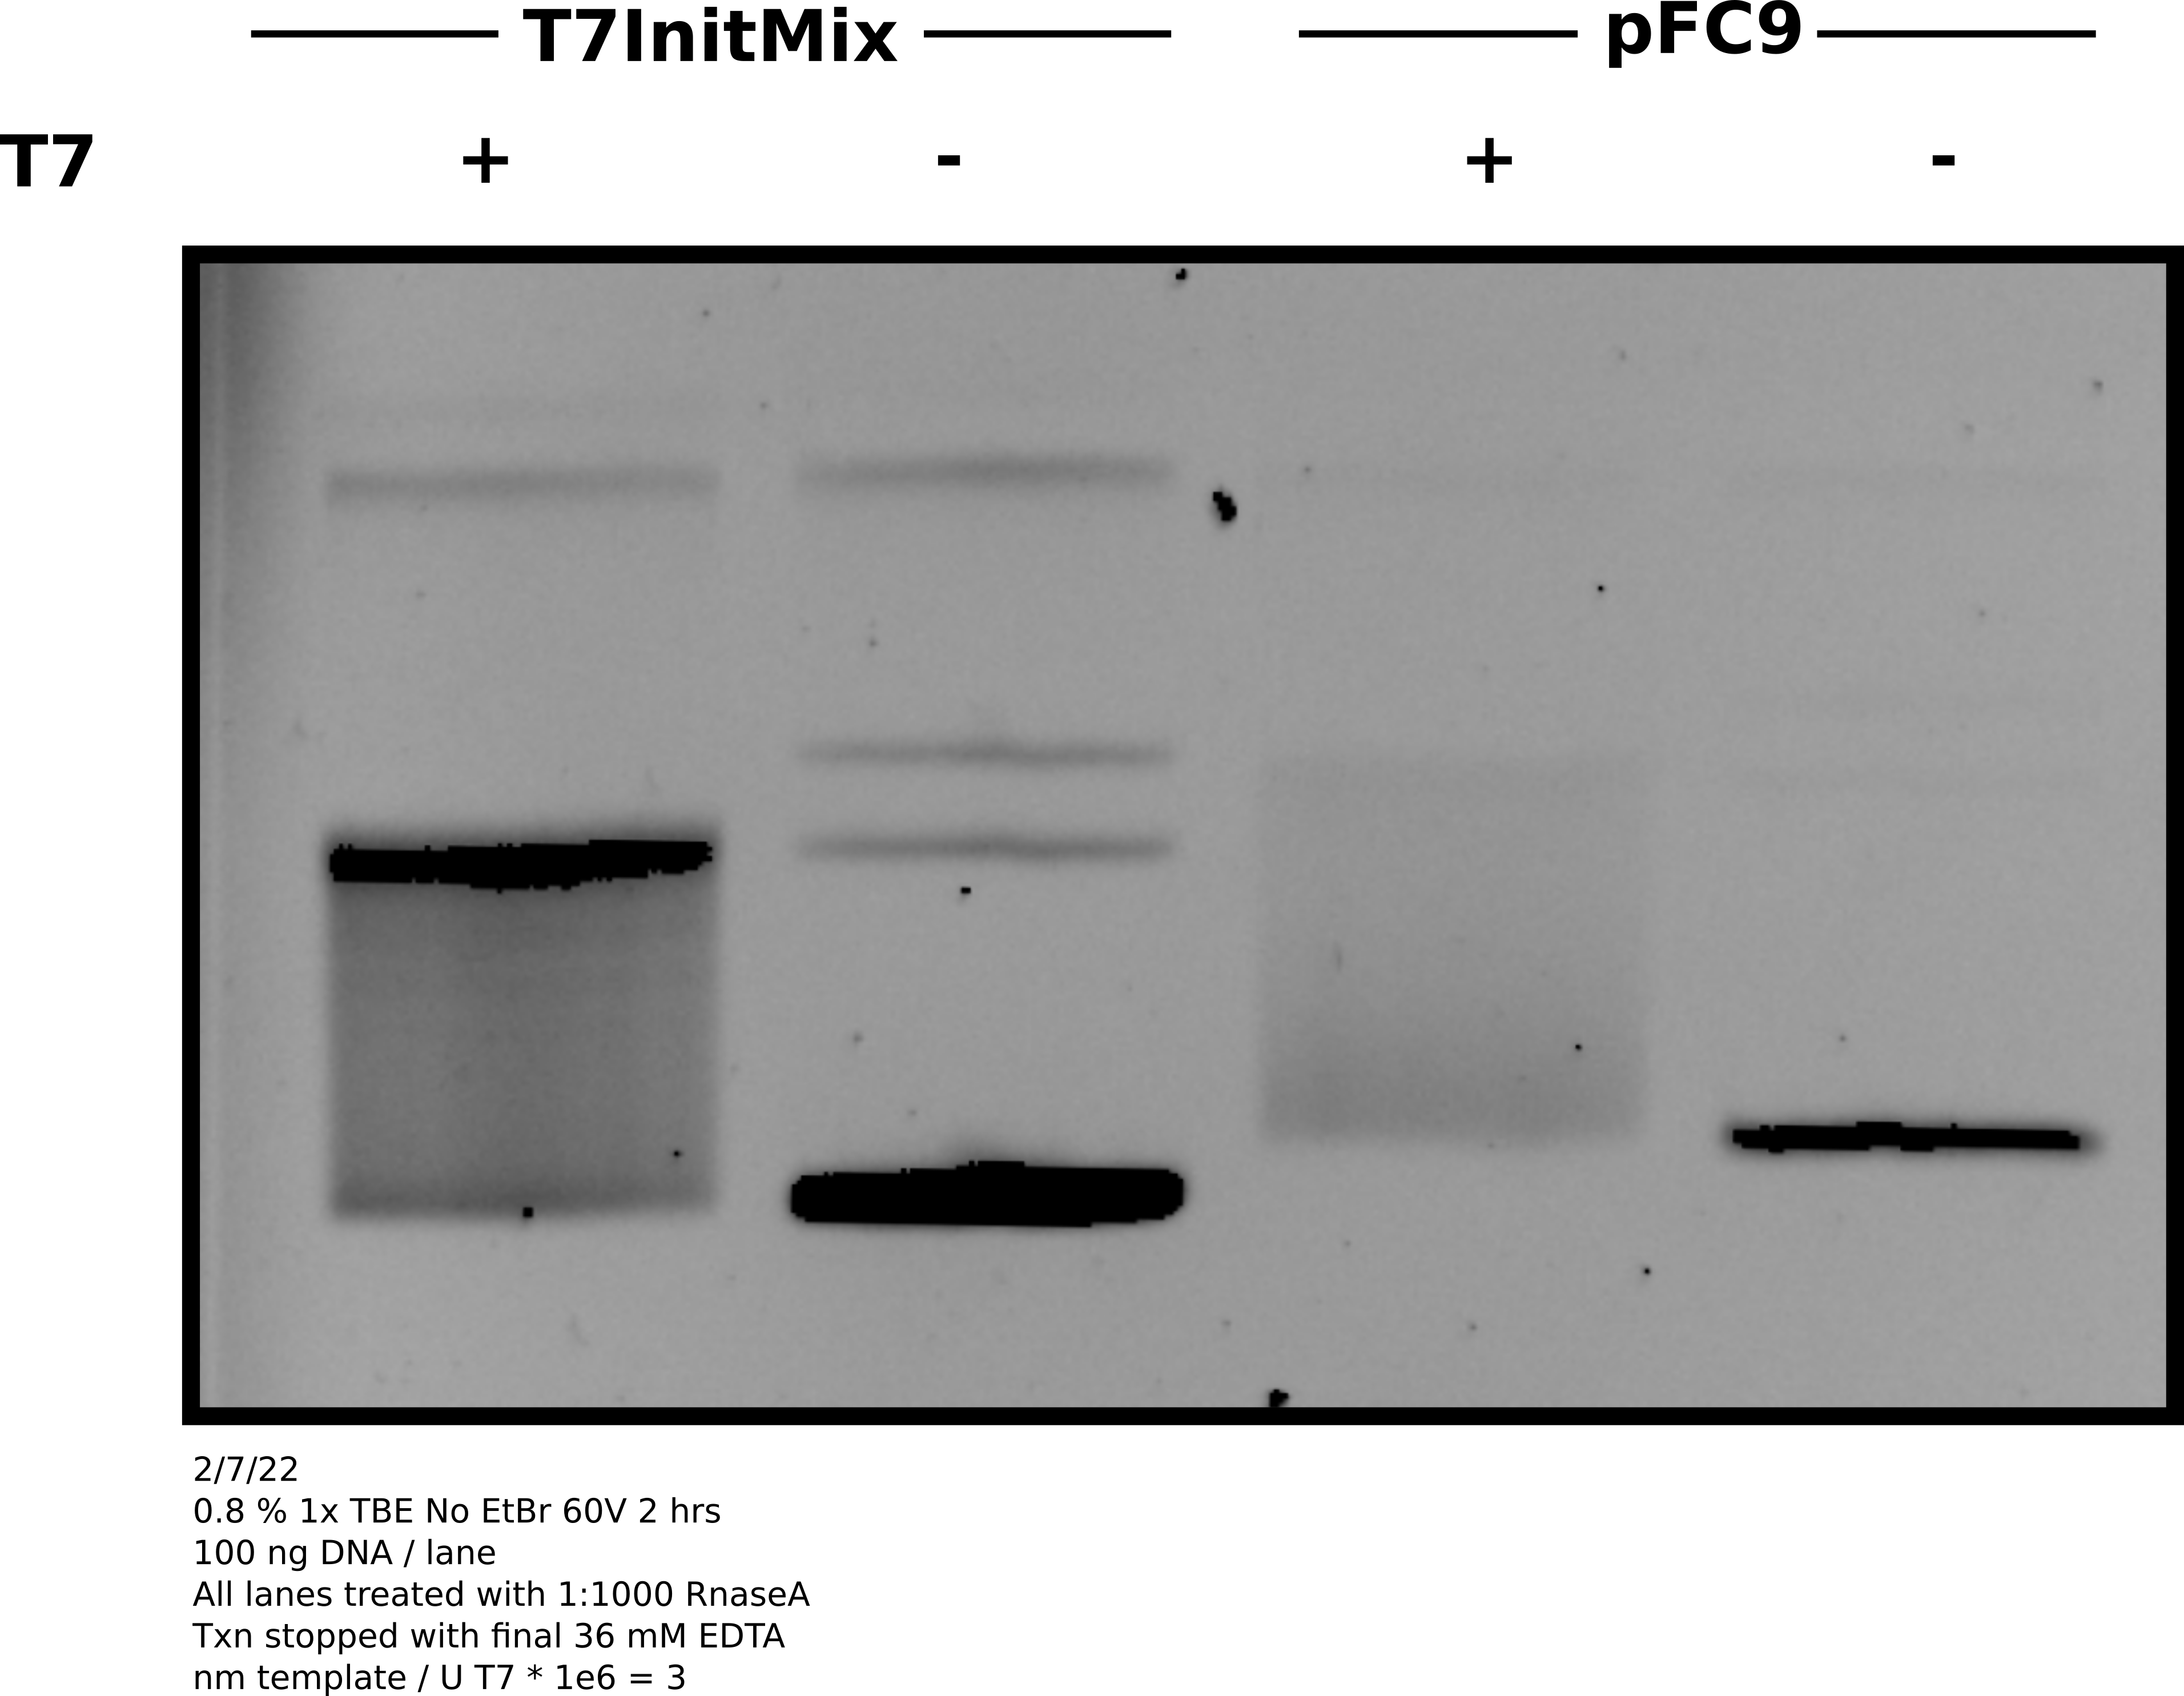
Analysis #
Overall the gel looks good and basically as expected. Both samples shifting to the relaxed band indicating R-loop formation. Concentration of pFC9 may be bit lower than 300 ng / ul as signal looks weaker than T7Init mix. May be worth remeasuring with the QuBit to get a more accurate concentration.
3/10/22 #
See this sections notes for details on follow up reaction I ran using a different kit. It made more sense to me to include to a later section.
PCR amplification of bisulfite treated samples: testing annealing temperatures #
2/8/22 #
Template prep #
Thawed samples 1 and 2 from yesterday and measured sample concentrations using the nanodrop against the elution buffer used to resuspend samples. Concentration measurements are shown in the table below.
| Sample | Name | Concentration (ng / ul) | Volume (ul) | Total DNA mass (ng) | Yeild |
|---|---|---|---|---|---|
| 1 | T7InitMix+TXN | 11 | 16 | 176 | 0.44 |
| 2 | T7INITMIX-TXN | 29.7 | 10 | 297 | 0.7425 |
~400 ng of each sample went into the bisulfite conversion reaction. Yields were a bit low compared to the 80% efficiency advertised by the kit. It does make sense to me though that the transcribed sample yield would be lower as more bisulfite conversion should be taking place.
PCR prep #
Prepared PCR reactions from master mixes when possible using the volumes
calculated in this spreadsheet.
I am only focused on optimizing annealing temperatures at the moment and so am
testing all conditions with PacBioBarFwd-0 as the forward primer and
PacBioRev-0 as the reverse primer. A summary of the PCR reactions I ran
is shown in the table below.
Annealing temp PCR test summary
| Sample number | Master Mix | Master Mix volume | DNA Mass (ng) | Annealing temp (C) | Annealing time (s) | Extension time (s) | Cycles |
|---|---|---|---|---|---|---|---|
| 1 | Pol + T7InitMix+TXN | 20 | 9.999 | 45 | 30 | 66 | 35 |
| 2 | Pol + T7InitMix+TXN | 20 | 9.999 | 48.4 | 30 | 66 | 35 |
| 3 | Pol + T7InitMix+TXN | 20 | 9.999 | 54.4 | 30 | 66 | 35 |
| 4 | Pol + T7InitMix+TXN | 20 | 9.999 | 58.9 | 30 | 66 | 35 |
| 5 | Pol + T7INITMIX-TXN | 20 | 10.0089 | 45 | 30 | 66 | 35 |
| 6 | Pol + T7INITMIX-TXN | 20 | 10.0089 | 48.4 | 30 | 66 | 35 |
| 7 | Pol + T7INITMIX-TXN | 20 | 10.0089 | 54.4 | 30 | 66 | 35 |
| 8 | Pol + T7INITMIX-TXN | 20 | 10.0089 | 58.9 | 30 | 66 | 35 |
| 9 | Pol + | 20 | 0 | 45 | 30 | 66 | 35 |
| 10 | No Template or Pol | 20 | 0 | 48.4 | 30 | 66 | 35 |
All samples were prepared in the TC room hood.
PCR results #
After completing 35 cycles I ran 18 ul of each sample on an agarose gel shown in the image below. Used 1.5 ul 1kb gene ruler.
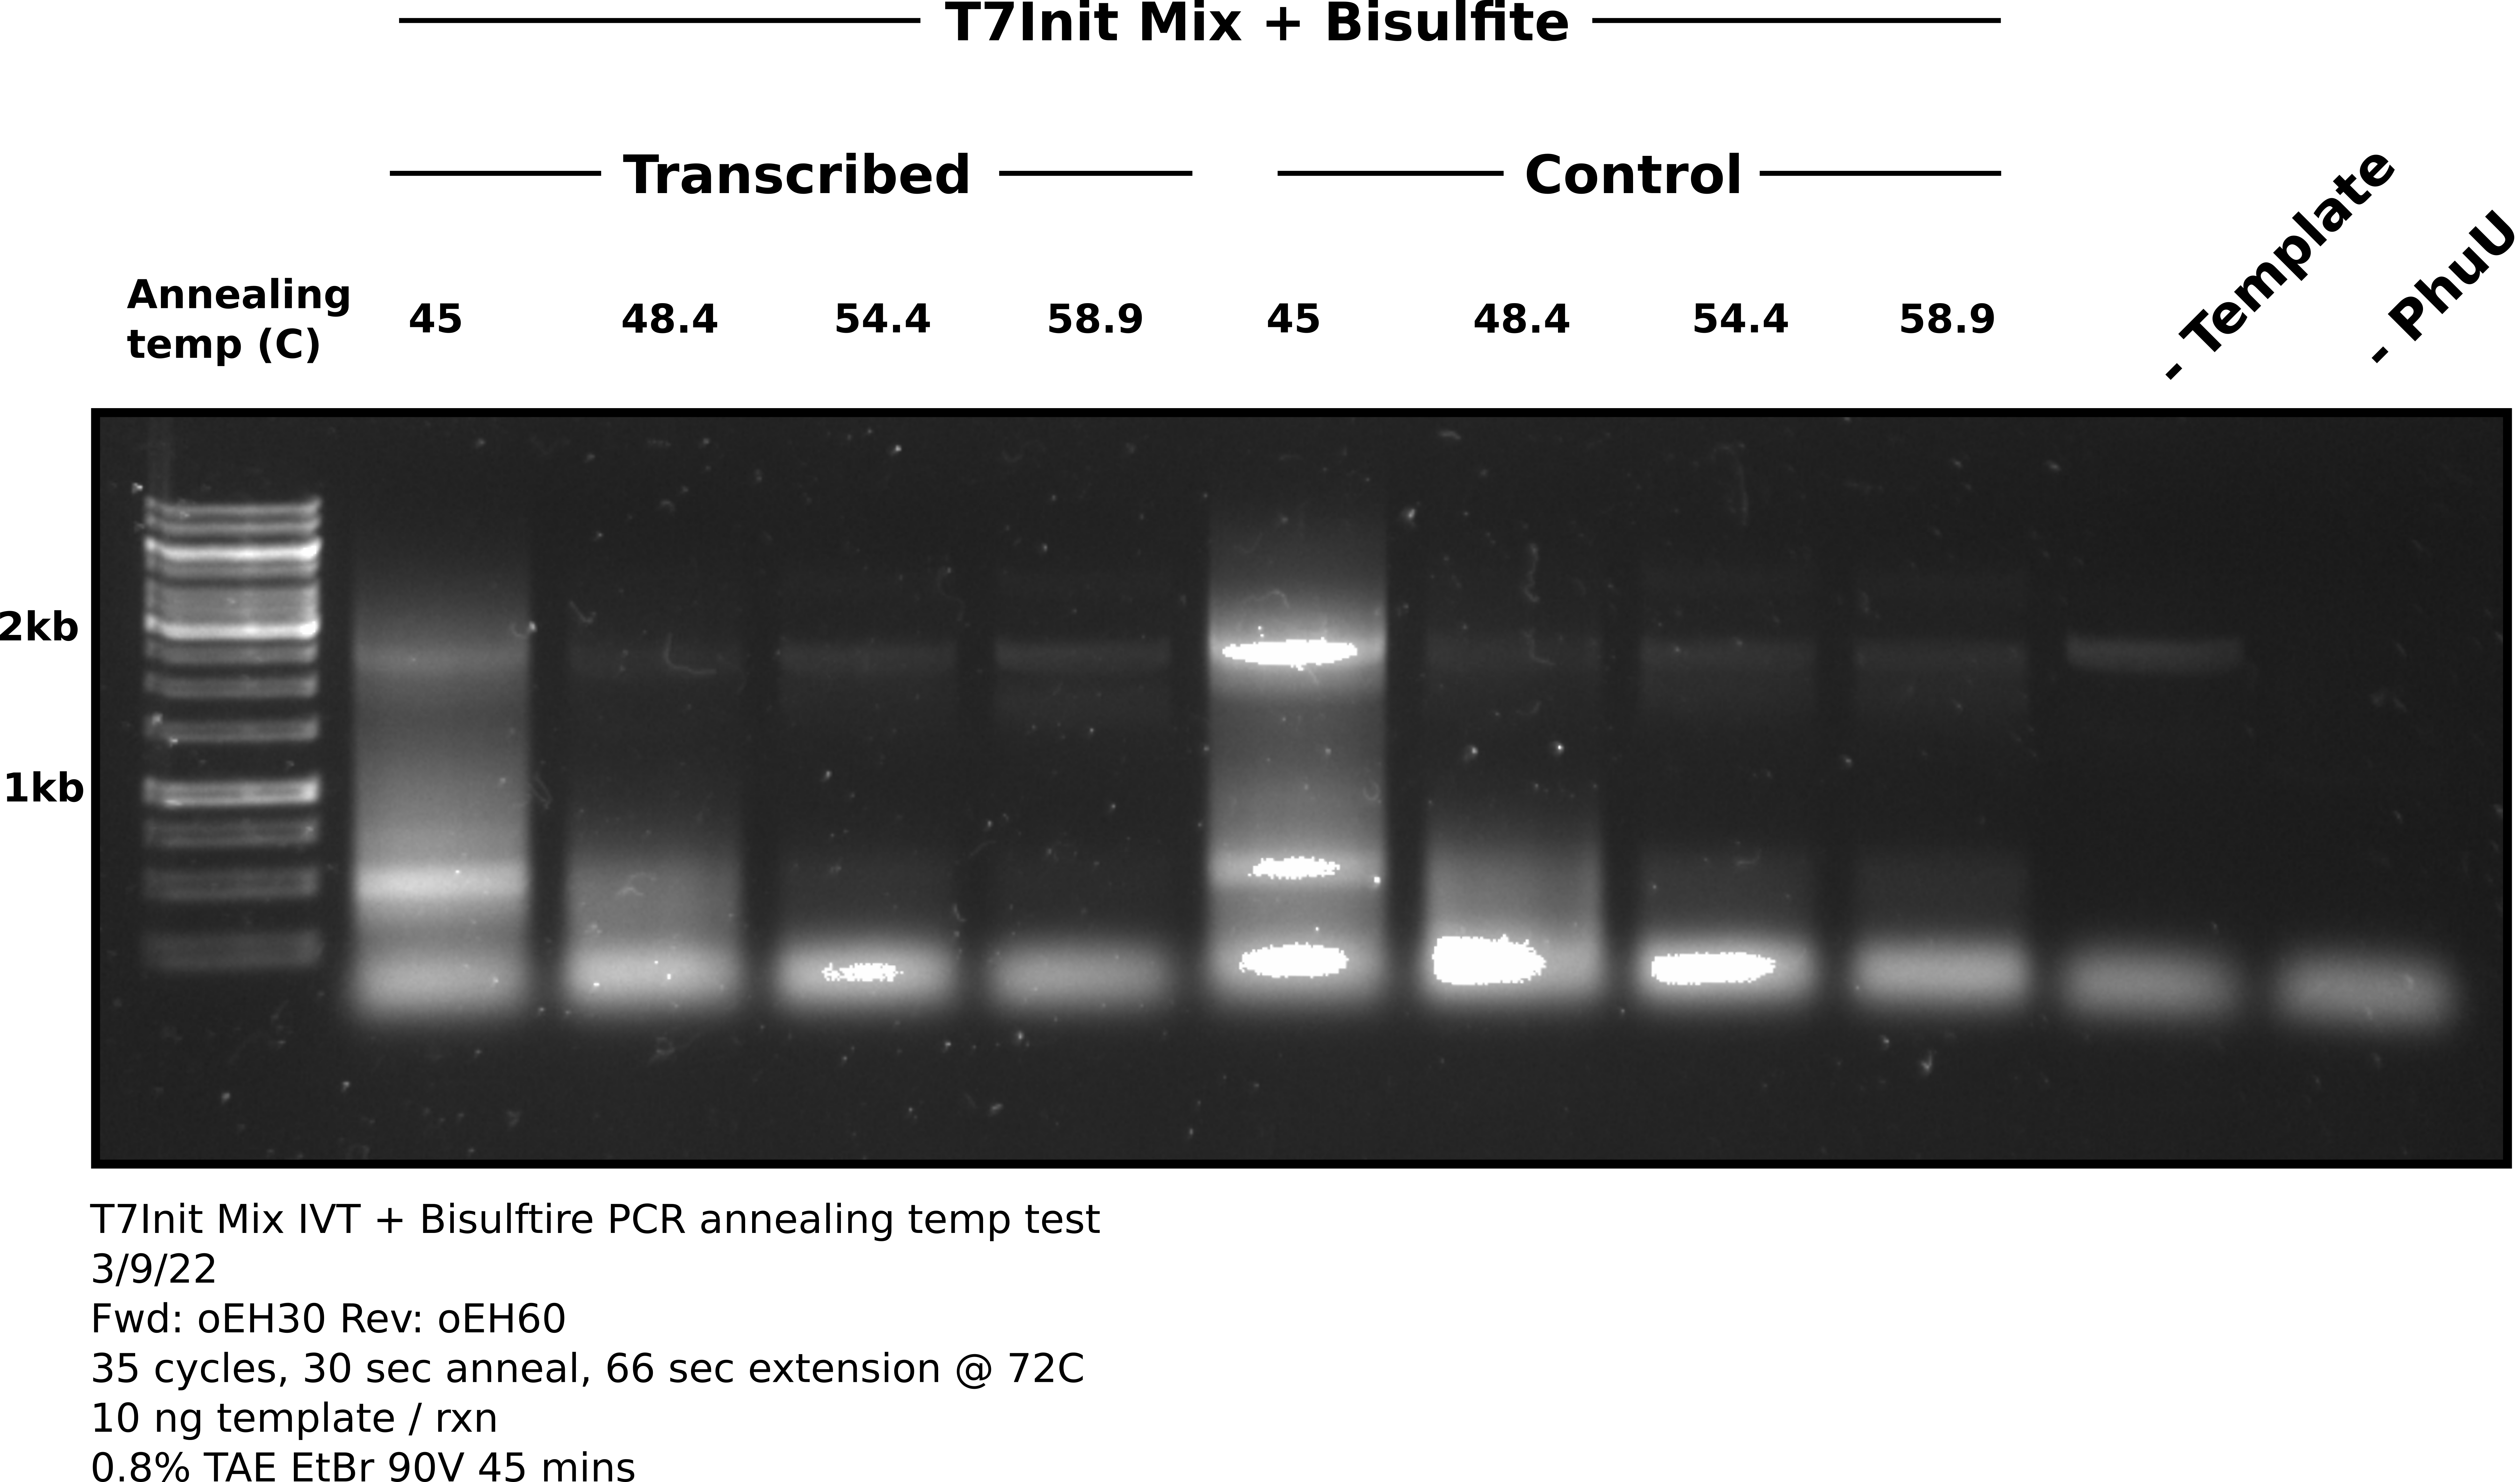
Analysis #
Considering how much of the reaction was run on the gel I was expecting much brighter bands at the expected product height of ~2.5 kb. It appears that amplification did occur but was very, very weak even after 35 cycles. There is also equally band band in the negative control at the product height indicating some template got into this sample or master mix. Band is not present when PhuU is not in the mix.
In terms of temperature for future reactions, it looks like anything below 54.4 C results in non-specific products with 54.4 not looking that different from 58.9. Moving forward should be safe to use annealing temps in this range.
Troubleshooting low yields #
While I was trying to figure out next steps I looked back at Maika’s notes, specifically at her PCR reactions following bisulfite conversions. Found a series of PCR reactions on bisulfite converted genomic DNA, shown in the image below.
From my calculations she used 50 ng of DNA per reaction. While this would have been genomic DNA, it is 5x the amount I used in my own reaction. Additionally, while expected amplicon length is about the same (~2.5 kb) her extension time is a minute longer. Again genomic DNA is being used so in general PhuU protocols recommend increased time and concentrations but I think it is worth a shot to replicate with my plasmid samples.
3/9/22 #
Replicating Maika’s PhuU PCR reactions #
Set up three reactions described in the table below following protocol described in Maika’s lab notebook. Using 50 ng of template per reaction.
| Total volume (ul) | 5x Phusion GC buffer | 10 mM dNTPs | Diluted PacBioBarFwd-0 | Diluted PacBioRev-0 | Template | Template volume | PhusionU volume | npH20 |
|---|---|---|---|---|---|---|---|---|
| 30 | 6 | 0.6 | 2.4 | 2.4 | T7InitMix+TXN | 4.545454545 | 0.4 | 13.65454545 |
| 30 | 6 | 0.6 | 2.4 | 2.4 | pFC9 | 1 | 0.4 | 17.2 |
| 30 | 6 | 0.6 | 2.4 | 2.4 | CTRL | 0 | 0.4 | 18.2 |
Increased extension time to 2.5 minutes, running for 28 cycles.
Agarose gel #
1.5 ul 1kb Generuler.
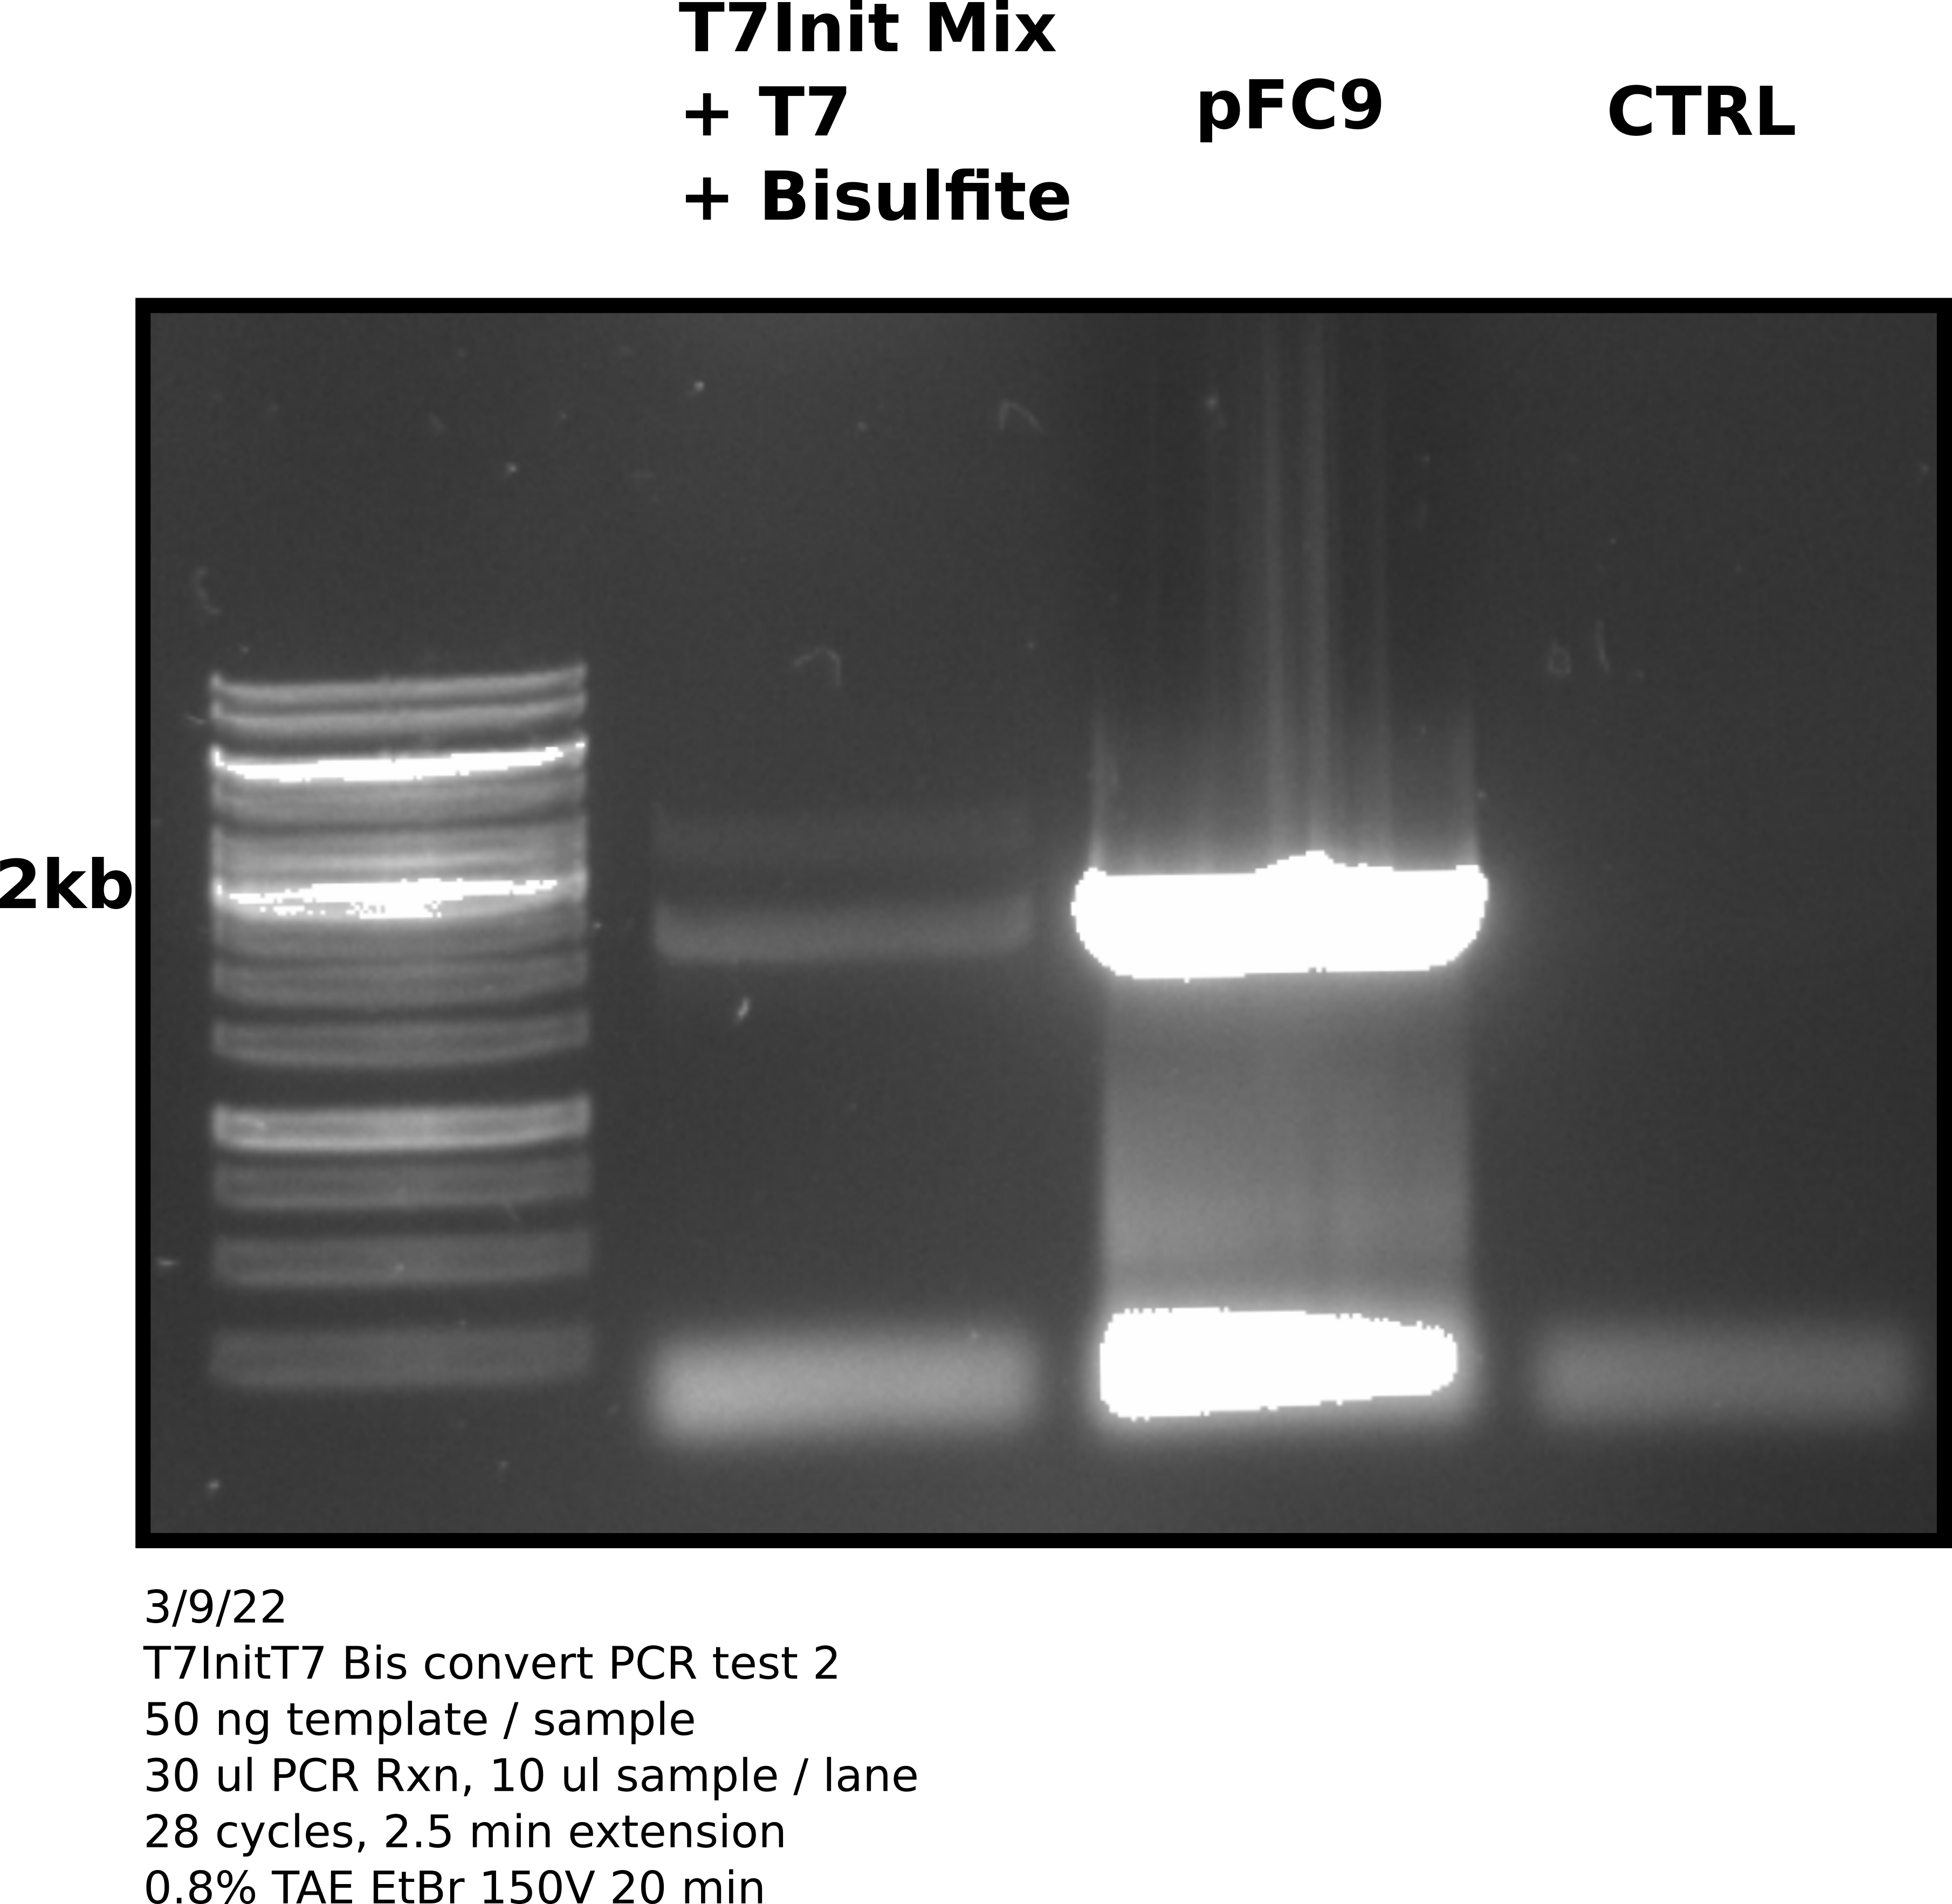
Analysis #
Good news is that PCR reaction and primers work as indicated by amplification of pFC9 and the negative control (no template was clean). However, amplification of the bisulfite converted and transcribed T7Init Mix was still not great. In fact since more template was used it may just be template DNA in the bisulfite converted lane.
In fact looking at a simulated gel of the amplicons produced by PCR with PacBio prirs for the T7 Mix (lane 1) and pFC9 (lane 2) reveals that fragments should be at slightly different heights.
This gel may actually be saying amplification was strong with pFC9 as a template and no amplification occured with bisulfite converted T7Init mix. The next diagnostic should be PCR with un-converted T7Init mix, un transcribed but converted T7Init mix and finally pFC9 as the positive control.
3/10/22 #
PCR controls #
Picking up where I left off yesterday and doing PCR reaction with un-converted T7Init mix, un-transcribed but converted T7Init mix and pFC9.
Reaction setup #
Reactions setup in the TC hood according to the tables below. Complete reaction descriptions with dilutions at this link.
PCR reaction setup
Samples
| Total volume (ul) | 5x Phusion GC buffer | 10 mM dNTPs | Diluted PacBioBarFwd-0 | Diluted PacBioRev-0 | Template | Template volume | PhusionU volume | npH20 |
|---|---|---|---|---|---|---|---|---|
| 30 | 6 | 0.6 | 2.4 | 2.4 | T7InitMix-TXN | 2.7 | 0.4 | 15.5 |
| 30 | 6 | 0.6 | 2.4 | 2.4 | T7InitMix | 1 | 0.4 | 17.2 |
| 30 | 6 | 0.6 | 2.4 | 2.4 | CTRL | 0 | 0.4 | 18.2 |
Reaction protocol #
Ran samples for 28 cycles with 2.5 minutes of extension at 72C. Annealing temp at 58.9C.
Results #
After reaction completed ran 3 ul of each sample on a 0.7% TAE agarose gel at 150V for 25 mins.
Agarose gel image #
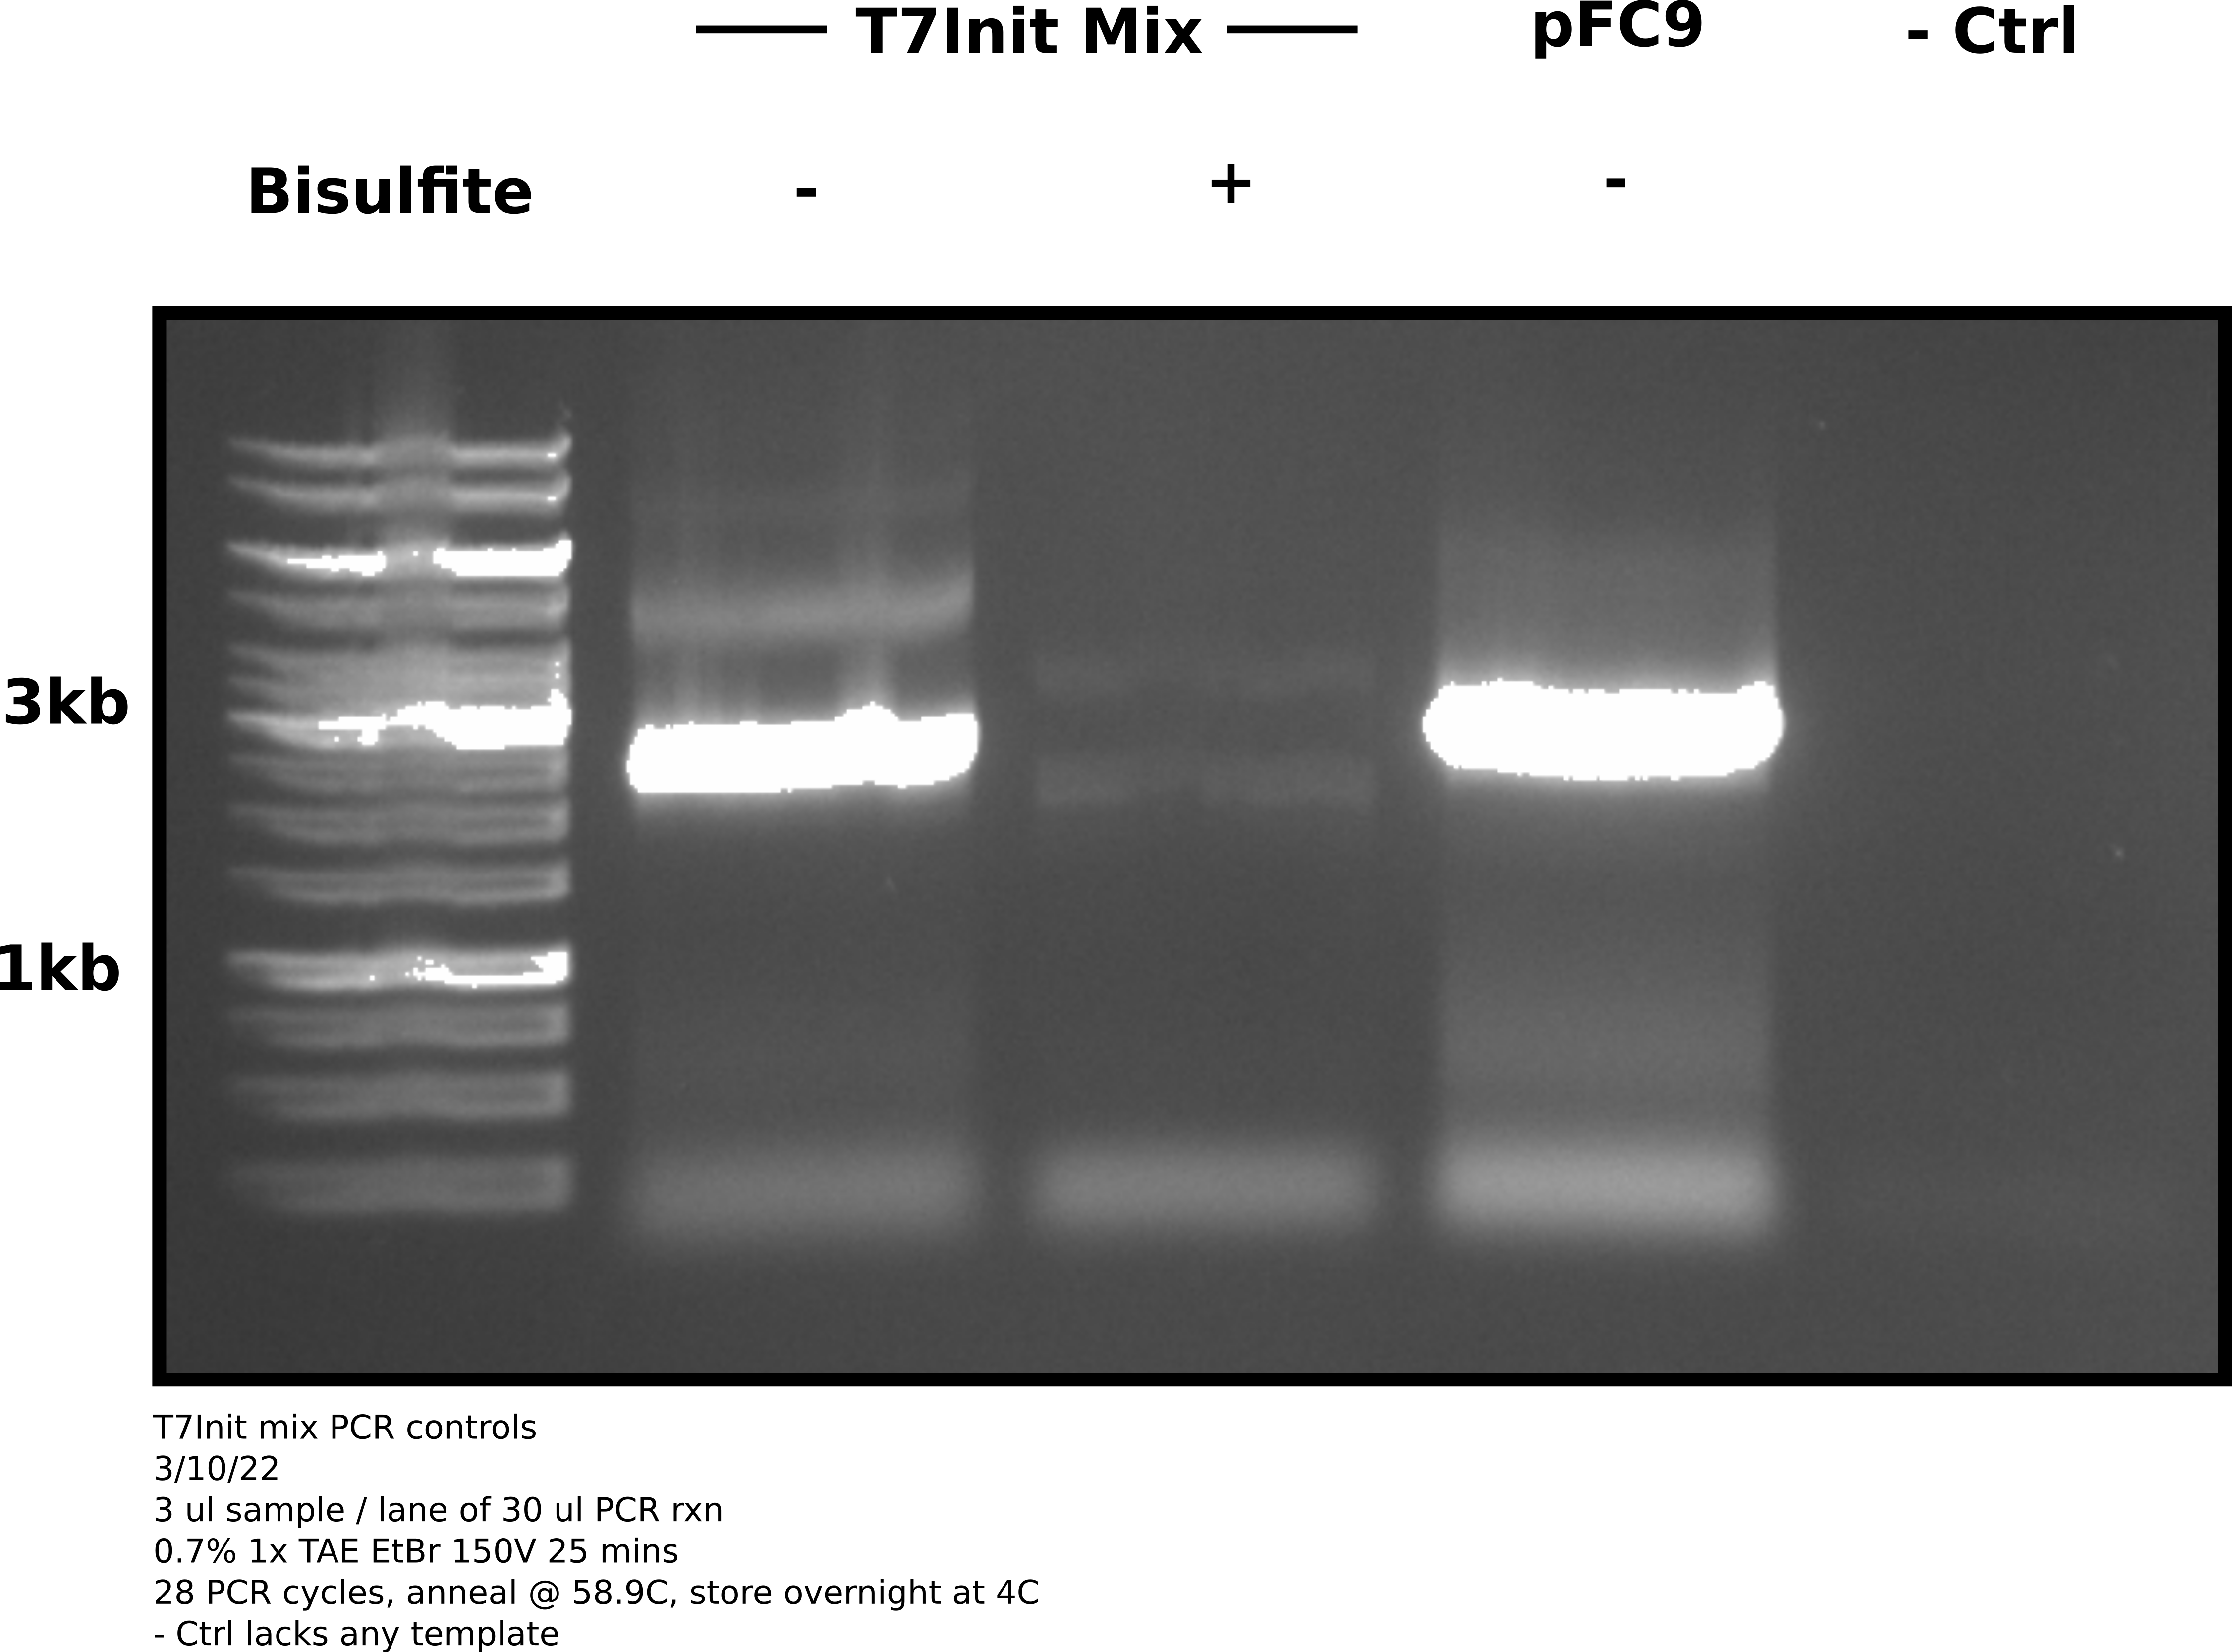
Analysis #
Based on this gel it appears that bisulfite treatment damaged plasmids so greatly (in this case even the un-transcribed reaction) that amplification was not possible. The un-converted T7Init mix clearly amplified and so did the pFC9 sample. Negative control shows no contamination.
The kit I used for the bisulfite reaction was previously opened while the bisulfite reagent is new (within last 2 months). Maybe this kits reagents have gone bad and are unable to quench the bisulfite conversion. I also allowed the desulf buffer to incubate for 15 minutes. The kit says 15-20 so next go around I’ll try 20. There is one newer un-opened kit so will redo IVT reaction and convert using new kit. I also ordered a fresh kit in case the un-opened one is also bad.
T7Init mix IVT and bisulfite conversion with un-opened kit #
Prepared IVT reactions as done previously. See this spreadsheet for a complete description of all reactions, reagents and dilutions used.
After completing 20 min incubation at 37C in thermocycler I added 1 ul of 0.5 M EDTA to all samples, spun down, and placed them on ice. I then removed 4 ul of each 20 ul reaction (~100 ng) to save for agarose gel. I added 3 ul npH20 to return reactions to total volume of 20 ul and then added 130 ul Zymogen lightning DNA conversion reagent. Transfered samples to blacked-out 1.5 ml tubes and taped into rotissery and rotated at 37C for 2 hours.
After rotissery incubation completed Zymogen kit protocol using the directions provided by manufactuer.
Eluted DNA and measured sample concentrations using the nanodrop shown in the table below.
| Template | Sample number | Concentration (ng/ul) |
|---|---|---|
| T7InitMix+TXN | 1 | 15.9 |
| T7InitMix-TXN | 2 | 29.6 |
PCR of bisulfite converted plasmids #
Reaction setup #
Complete reaction details at this link.
PCR reaction setup
| Total volume (ul) | 5x Phusion GC buffer | 10 mM dNTPs | Diluted PacBioBarFwd-0 | Diluted PacBioRev-0 | Template | Template volume | PhusionU volume | npH20 |
|---|---|---|---|---|---|---|---|---|
| 30 | 6 | 0.6 | 2.4 | 2.4 | T7InitMix-TXN | 1.572327044 | 0.4 | 16.62767296 |
| 30 | 6 | 0.6 | 2.4 | 2.4 | T7InitMix-TXN | 0.8445945946 | 0.4 | 17.35540541 |
| 30 | 6 | 0.6 | 2.4 | 2.4 | T7InitMix | 1 | 0.4 | 17.2 |
| 30 | 6 | 0.6 | 2.4 | 2.4 | CTRL | 0 | 0.4 | 18.2 |
Reaction protocol #
Reaction was run as described here.
Results #
After reaction completed ran 3 ul of each sample on a 0.7% TAE agarose gel at 150V for 25 mins.
Agarose gel image #
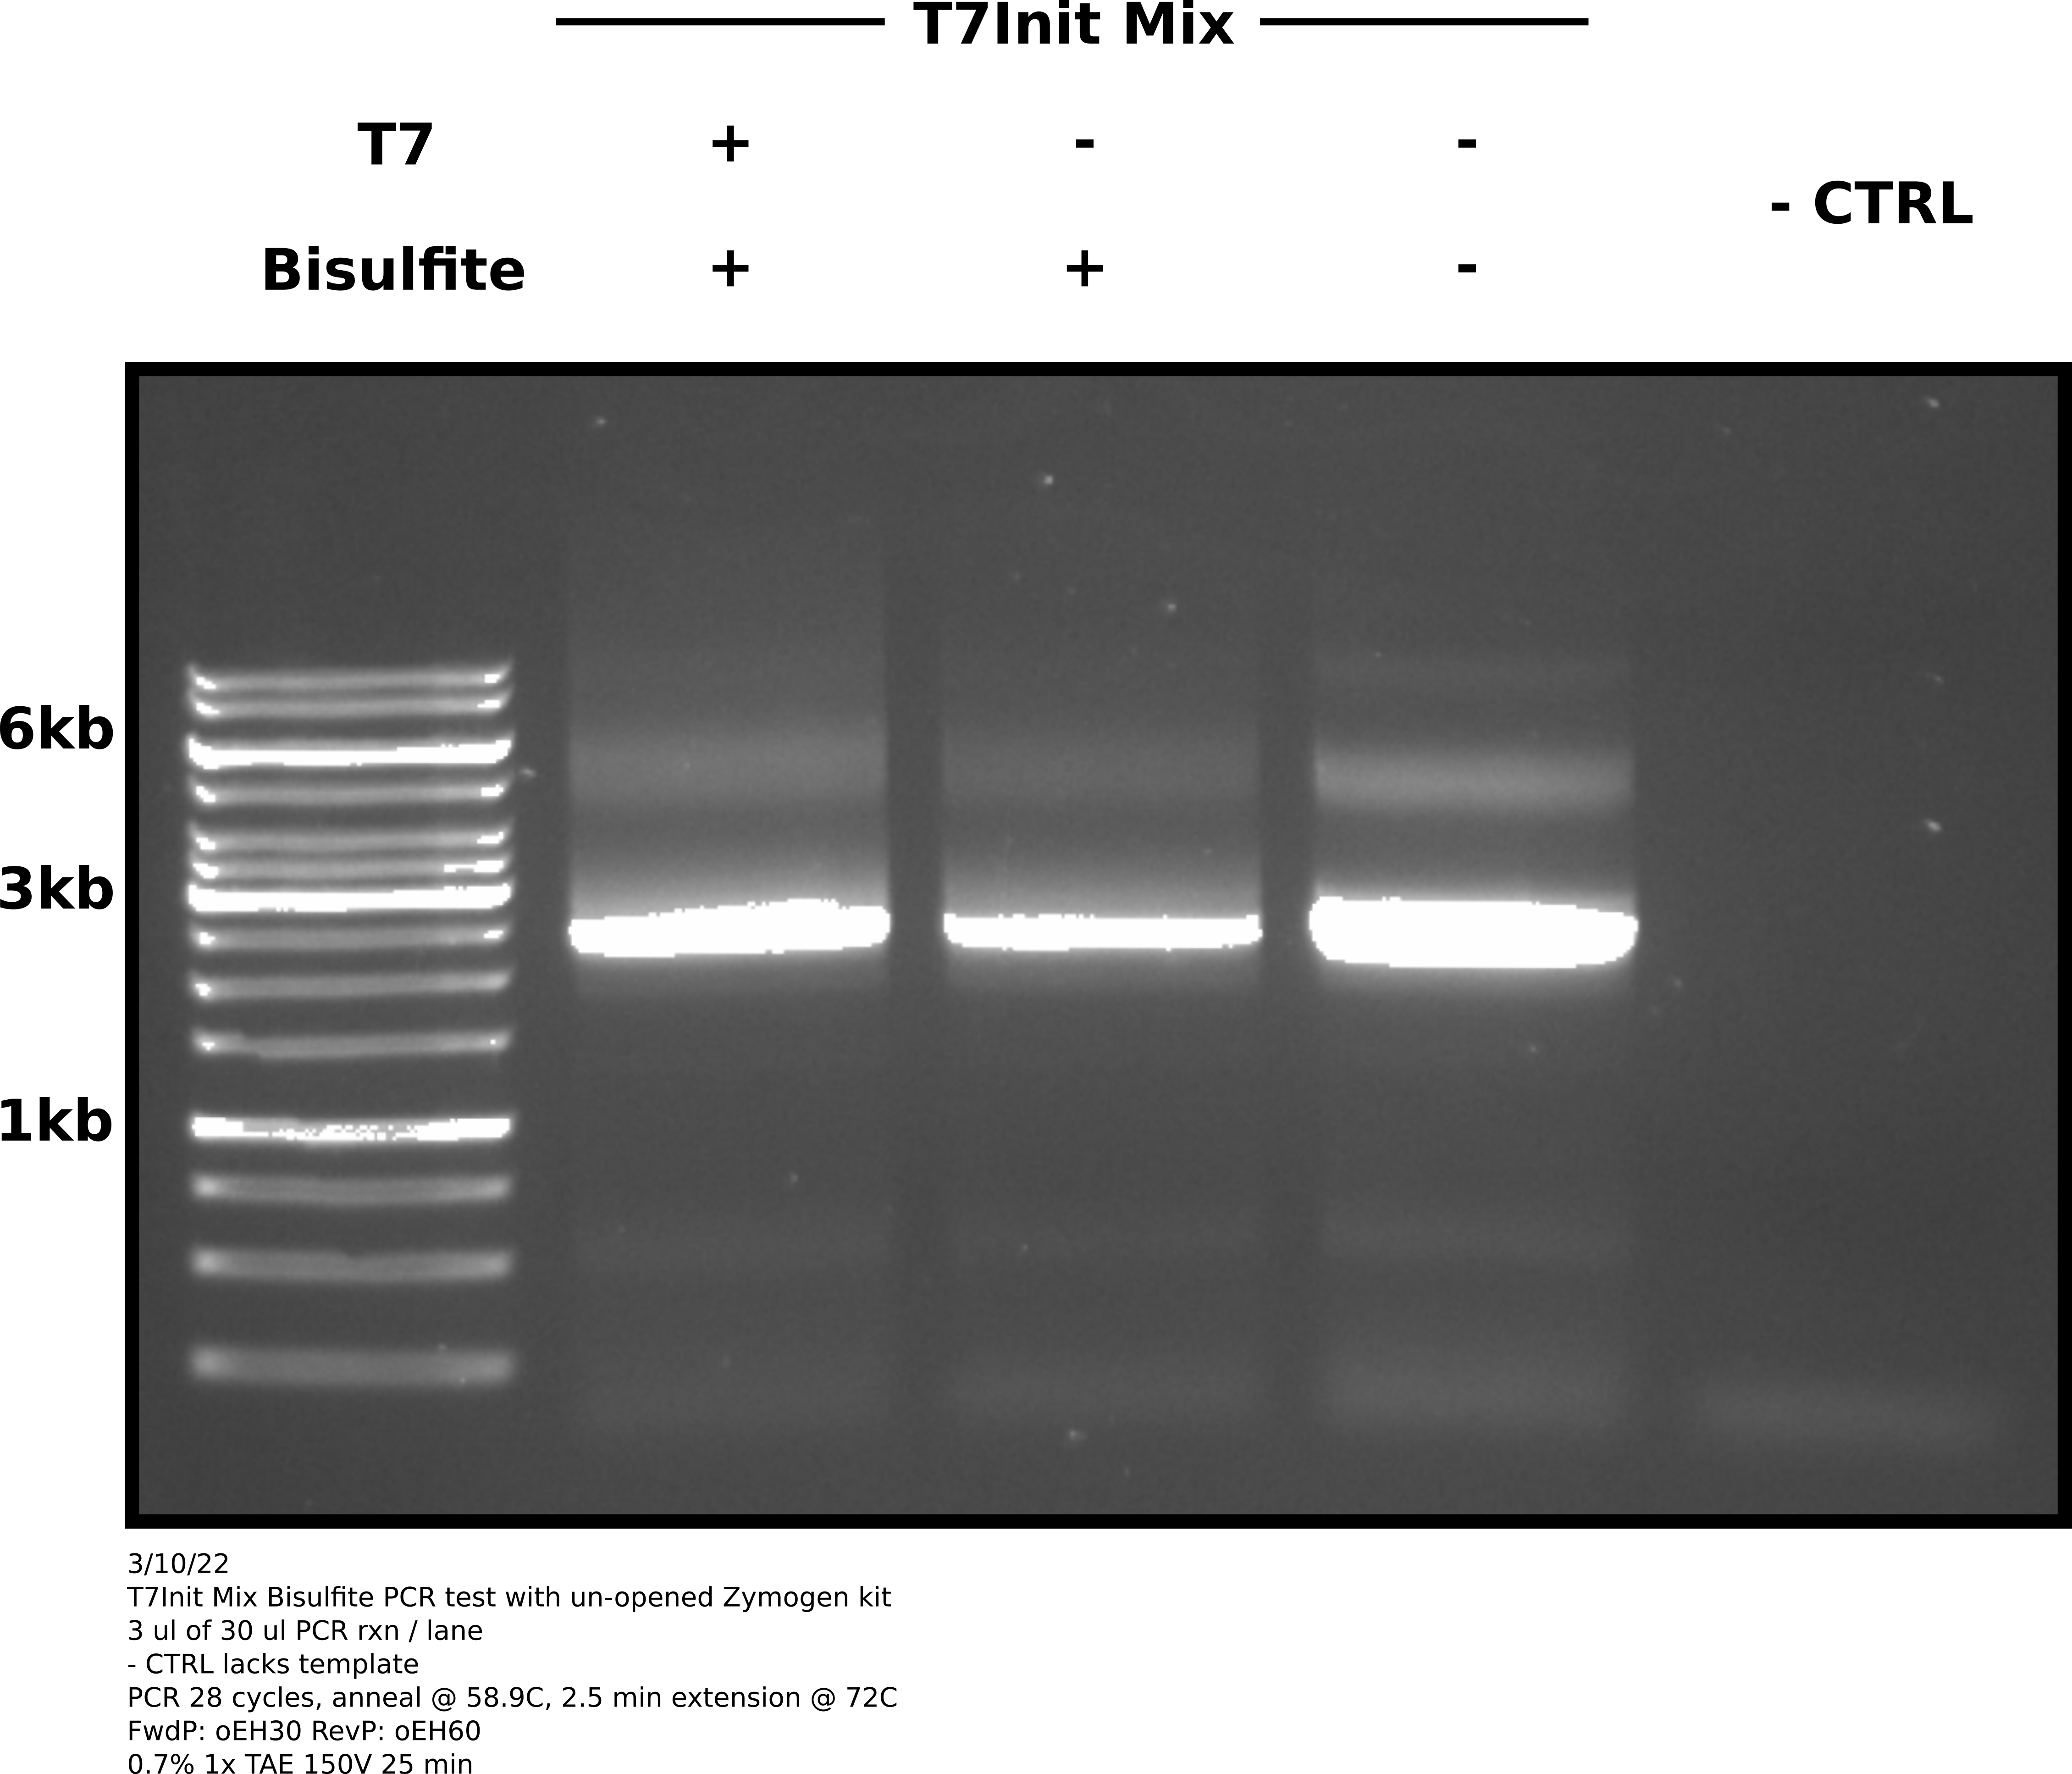
Analysis #
Looks like the old kit was the issue. This gel clearly shows amplification of both bisulfite treated samples as well as the untreated T7Init mix positive control. No visible amplification in the negative control lane (no template added).
There does still appear to be some non-specific product. Will run temperature gradient starting at 58.9C (annealing temp used in this reaction) and increase from there to see if can reduce non-specific product.
3/11/22 #
Running PCR reaction with bisulfite converted samples using the newer kit. These samples successfully amplified yesterday.
PCR reaction setup #
Master mixes
| Reagent | T7InitMix+TXN+Bis | T7Init Mix |
|---|---|---|
| npH20 | 54.68176101 | 54.68176101 |
| 5x GC Buffer | 17.6 | 17.6 |
| 10 mM dNTPS | 3.52 | 3.52 |
| 10 mM Primer mix | 4.4 | 4.4 |
| Template | 6.918238994 | 0.3548387097 |
| PhuU | 0.88 | 0.88 |
All reactions used oEH30 and oEH60 as forward and reverse primers respectively. Reactions run for 28 cycles with 2.5 minute extension time at 72C.
Agarose gel PCR products #
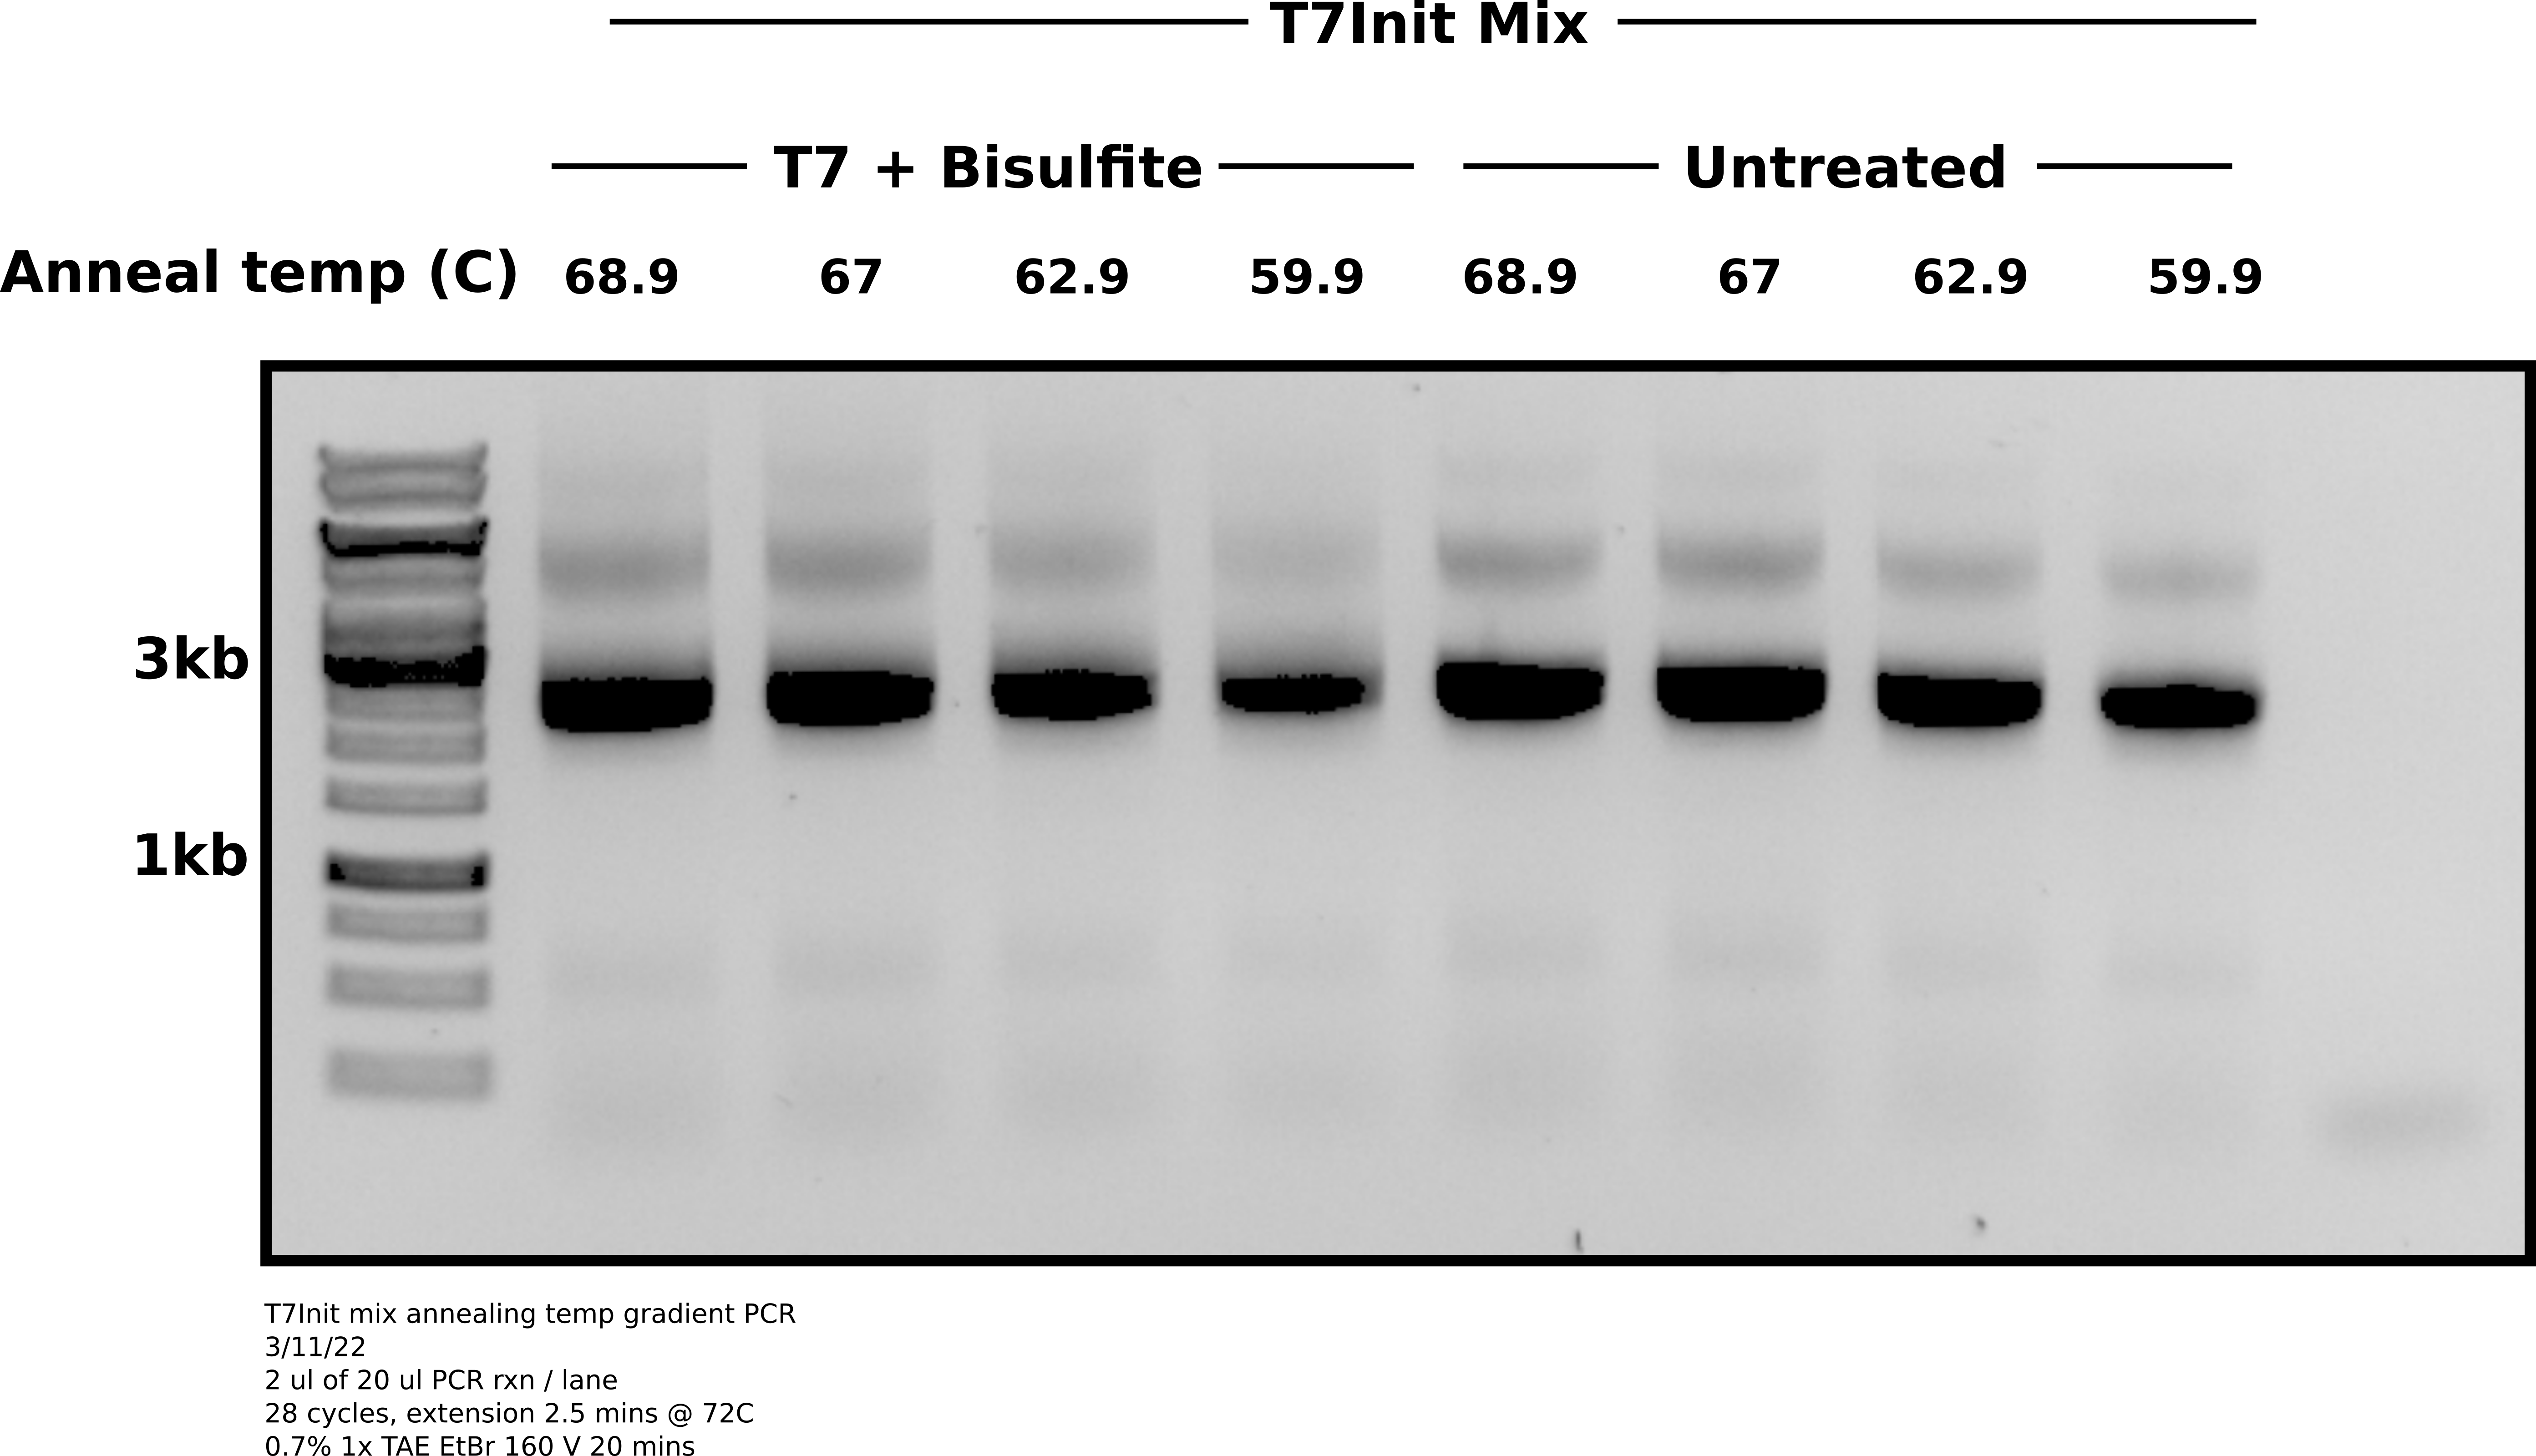
Analysis #
It seems that lower temperatures were actually slightly better at reducing the top band non-specific product. No condition completely removed it. It may just be necessary to preform agarose gel extraction on these PCR reactions to separate out the product from non-specific stuff. Will require running gels longer and slower to make easier to separate.
Optimizing number of PCR cycles for library amplification #
Ideally I would like to use as few PCR cycles as possible to amplify bisulfite treated samples destined for PacBio runs. Here I am attempting to do a sort of manual qPCR by withdrawing 5 ul aliquotes of PCR reaction at specific cycles.
3/15/22 #
PCR reaction setup #
Prepared PCR samples using oEH30 and oEH60 as forward and reverse primers respectively with T7Init Mix untranscribed and bisulfite treated as main test sample and untreated T7Init Mix as the positive control. Master mixes were prepared according to the table below.
Template concentrations
| Template | Concentration | Mass per rxn |
|---|---|---|
| T7InitMix-TXN+Bis | 29.6 | 25 |
| T7Init Mix | 310 | 25 |
Master mixes
| Template | T7InitMix-TXN+Bis | T7Init Mix |
|---|---|---|
| npH20 | 84.6527027 | 87.95806452 |
| 5x Phu GC buffer | 25.2 | 25.2 |
| PacBioFwd0 + Rev0 10mM primer mix | 6.3 | 6.3 |
| 10 mM dNTPs | 5.04 | 5.04 |
| Template (ul) | 3.547297297 | 0.2419354839 |
| PhuU | 1.26 | 1.26 |
| Total volume | 126 | 126 |
| Number rxns | 4.2 | 4.2 |
A total of 25 ng of template was used per reaction.
4 reactions per template. 1 without template to serve as negative control and 3 replicates with template. Total reaction volume is 30 ul. 5 ul removed at specific cycles for a total of 6 measurements. All samples prepared in TC hood.
PCR reaction #
Using standard PhuU protocol with 2.5 min extension time at 72C and annealing at 58.9C for 30 seconds. Removed 5 ul of sample at 5, 10, 15, 18, 25, and 28 cycles during the extension phase. I found that it was surprisingly difficult to pipette out 5 ul of sample, maybe due to high sample temp. After pipetting sample would sort of retreat up the length of the tip and I would often have to edject the tip and reattach to get the sample out. This also introduced a lot of seemingly impossible to pop bubbles into a few of the samples making pipeting out for a gel very difficult.
Quantification #
Using the ImageLAb software I used the absolute qunatification tool to measure DNA masses in the target amplicon band against the 1 ul of ladder used. Quantification data and code for visualization is available in this jupyter notebook.
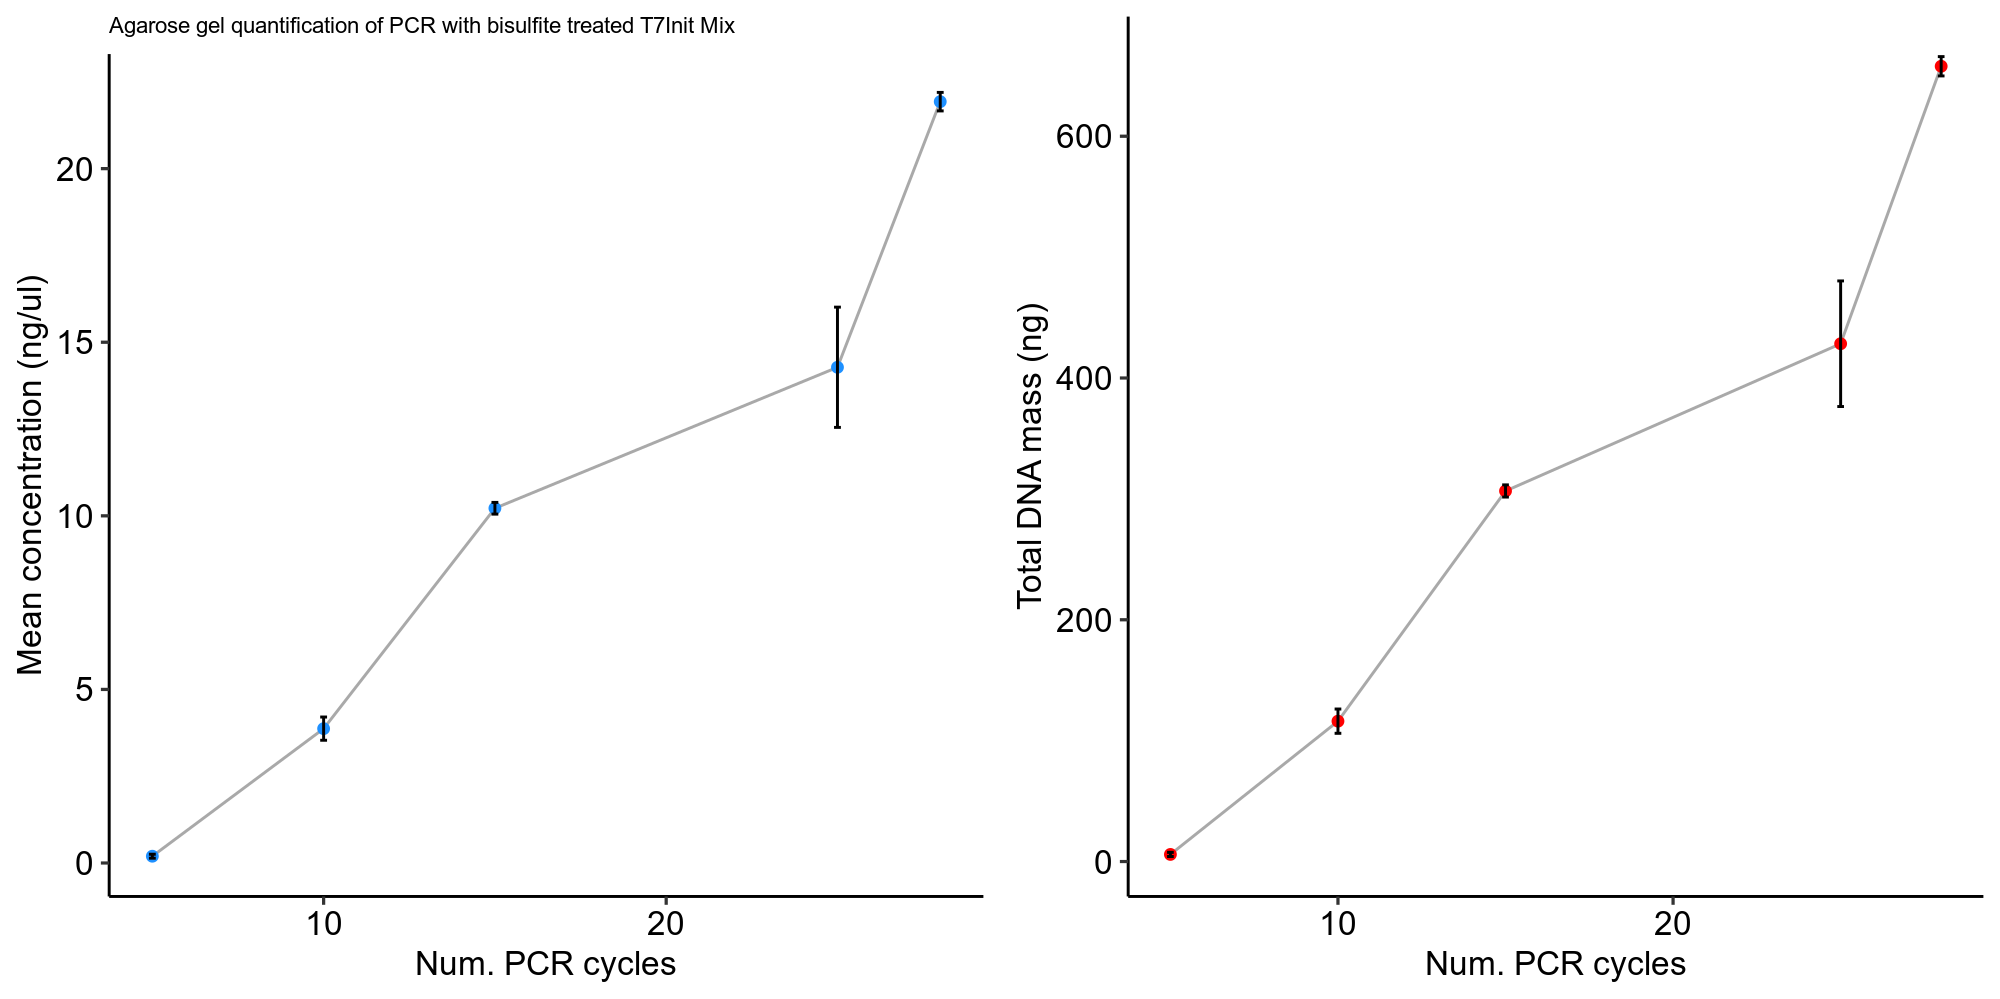 .
.
Analysis #
Honestly these values seem a bit low to me given the appearance of the gel. It would have been smart to QuBit or nanodrop these samples as well to see if gel quantification reflected concentration measurements.