Bisulfite reagent validation #
Experiments in this section are focused on both practicing bisulfite conversion techniques and validating the Zymogen bisulfite lightening reagents.
1/3/22 #
Bisulfite conversion test primers #
In order to test that bisulfite is working properly planning on carrying out reaction under de-naturing conditions and then amplifying and sequencing the products in order to access conversion efficiency. Since I am expecting very high conversion rates I designed primers to use for sequencing and amplification that assume 100% C -> T conversion frequency.
- Use treatBisulfite Python script to simulate 100% efficient bisulfite conversion.
- Design primers in SnapGene.
Do not use
pFC9-T7-deamreverse primer1/10/21: While thinking about PCR reaction for amplification of bisulfite converted products I realized that the reverse primer designed here will not work because it was designed to have homology to the reverse strand of the bisulfite converted top strand. However, in reality the two strands will not be complementary. Redesigned primers using Zymogen bisulfite primer tool and ordered. Primers are
pFC9BisP3FwdandpFC9BisP4Revand sequences are in the Ethan’s Oligo’s spreadsheet.The notes on these primers should be considered depreciated and are only being left up for archival purposes.
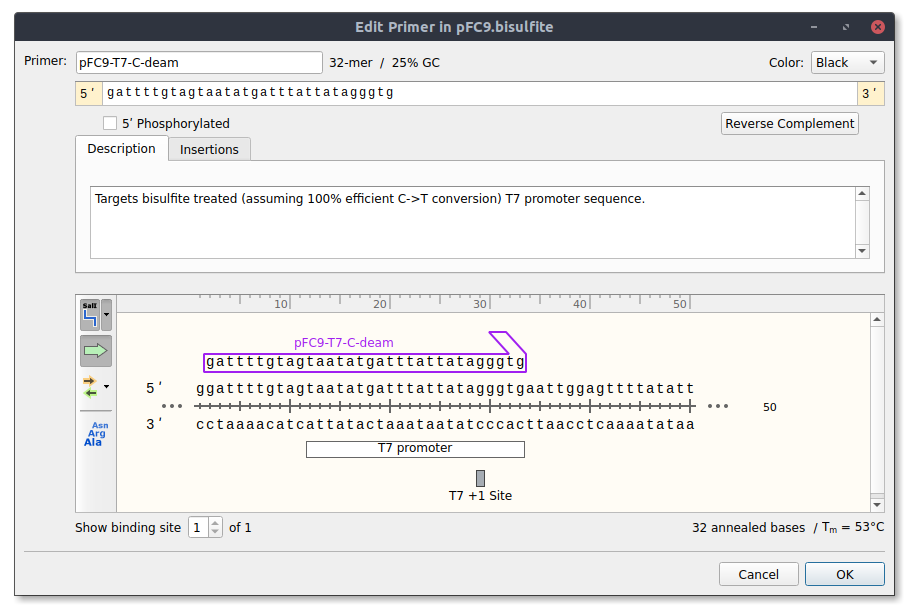
pFC9-T7-C-deam #
Targets bisulfite treated (assuming 100% efficient C->T conversion) T7 promoter sequence.
pFC9-C-deam-rev #
Reverse primer to be used with pFC9-T7-C-deam for
amplification of deaminated product.

Genbank file with primers added to pFC9VR1 plasmid can be downloaded here.
1/6/21 #
Bisulfite conversion test #
In order to test if on-hand bisulfite reagent is still good I went through Zymogen lightning methylation kit protocol with three samples of pFC9. Denaturing conditions were used for the bisulfite treatment (as described in the protocol).
Samples #
| Sample Number | Plasmid | Plasmid mass | Volume plasmid | Volume npH20 |
|---|---|---|---|---|
| 1 | pFC9 | 500 | 1.66 | 19.34 |
| 2 | pFC9 | 1000 | 3.33 | 16.67 |
| 3 | pFC9 | 2000 | 6.66 | 13.34 |
In order to test conversion was successful I should be able to sequence the higher concentration sample (3 and maybe 2) directly. Sample 1 will require PCR amplification first.
1/8/22 #
Bisulfite conversion test: Sequencing results #
Send 1/6/21 bisulfite conversion sample 3 for sequencing directly after conversion (no PCR). Read is basically just noise. Bisulfite may have been too damaging for direct sanger sequencing.
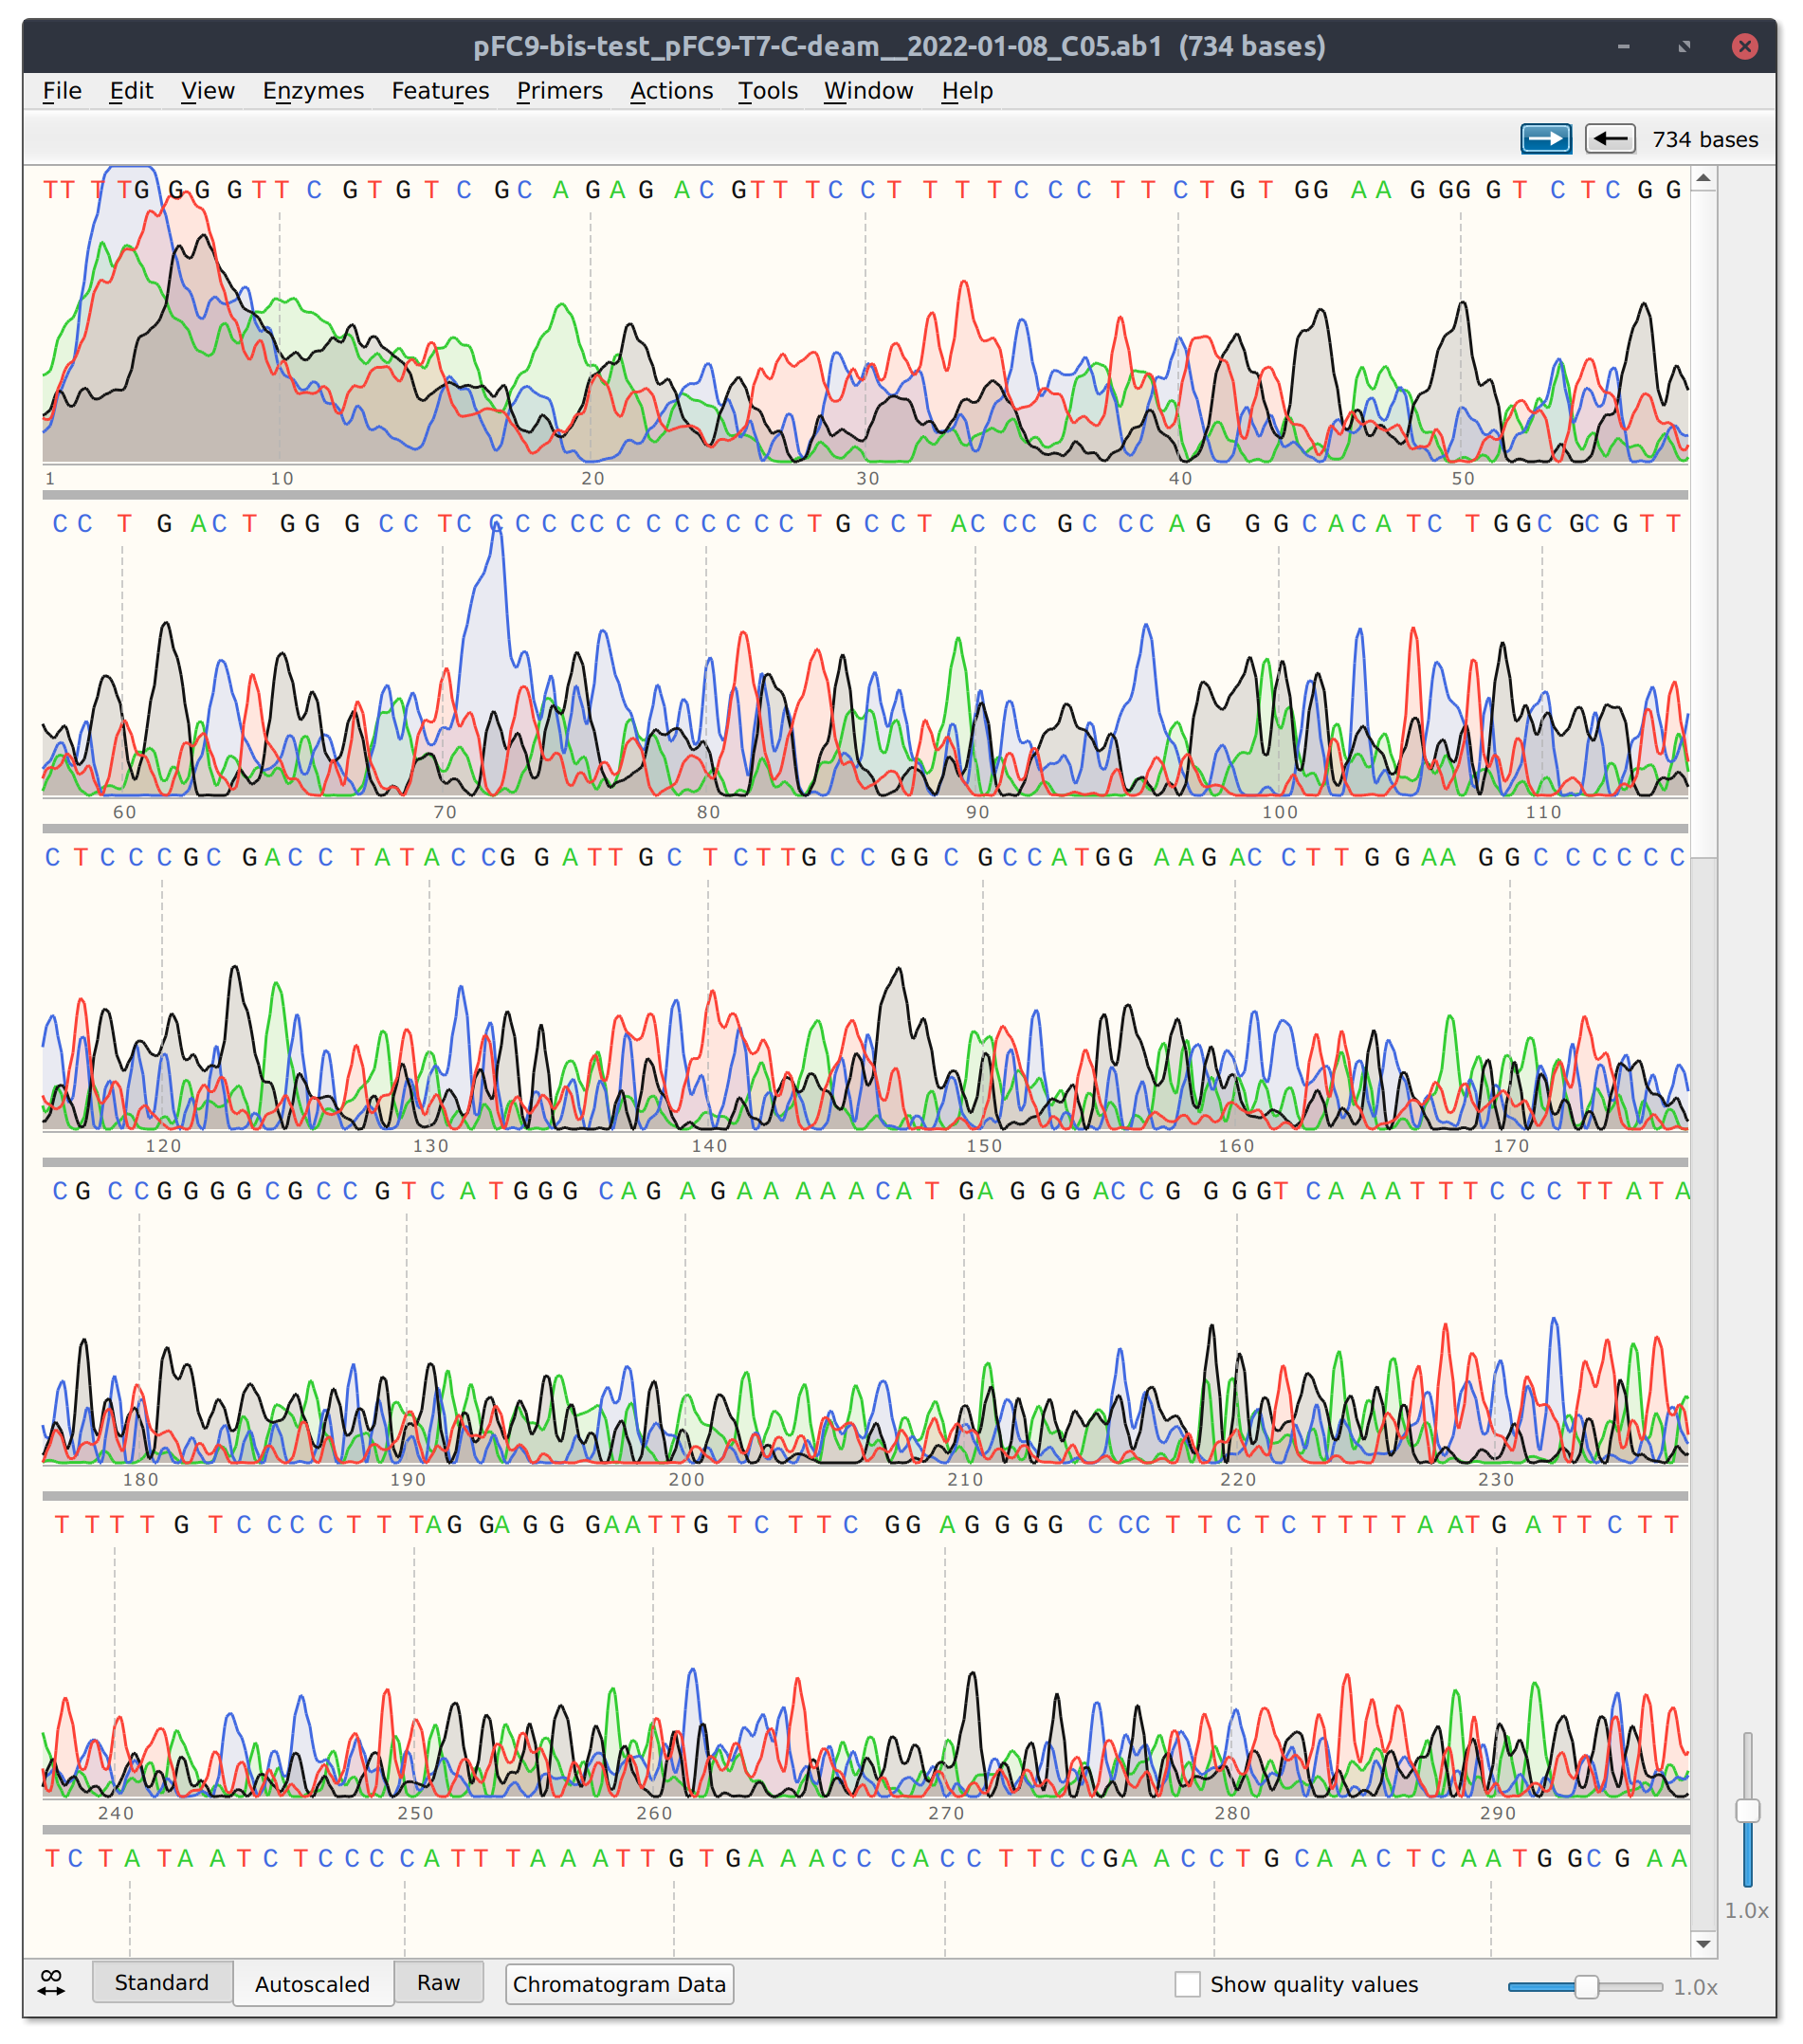
Will need to use PCR in future.
1/18/22 #
Bisulfite conversion test: PCR for sequencing #
Set up PCR reaction with 1/8/22 sample 1 in order to sequence products to verify conversions.
Reactions #
| Sample | Template | Lab Taq | dNTPs | pFC9BisP3Fwd | pFC9BisP4Rev | NEB Standard Taq buffer (10x) | npH20 | Total Volume |
|---|---|---|---|---|---|---|---|---|
| 1 | 0 | 0.25 | 0.5 | 1.25 | 1.25 | 2.5 | 19.25 | 25 |
| 2 | 0.5 | 0.25 | 0.5 | 1.25 | 1.25 | 2.5 | 18.25 | 25 |
Assembled reactions on ice in tissue culture hood. PCR for 34 cycles annealing temp of 50.5C. All volumes are in ul.
Agarose gel #
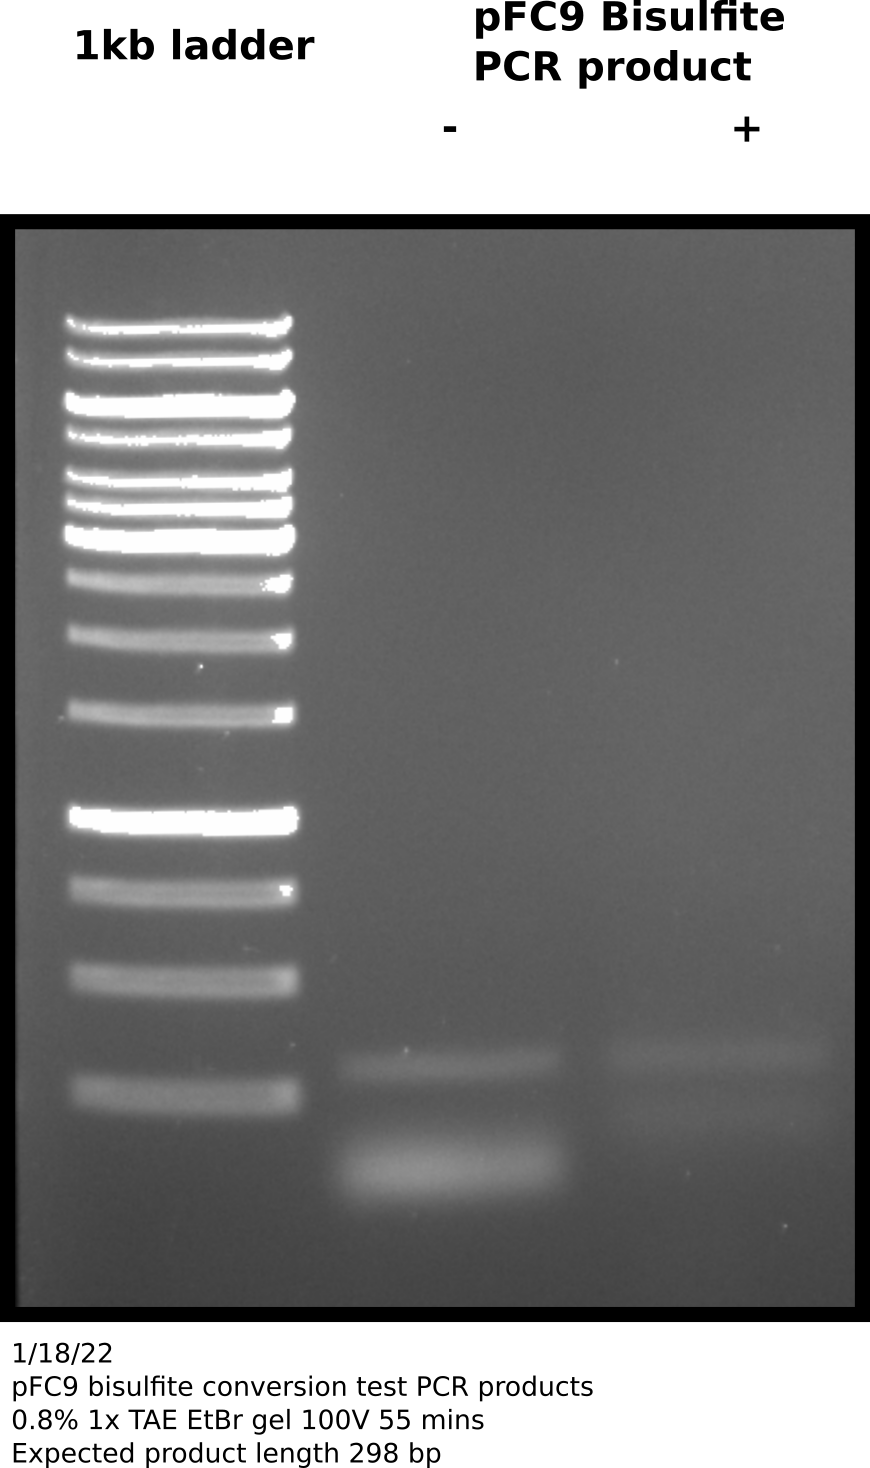
Appears that there is product at the expected height (298 bp) in both + and - samples. Negative control no bisulfite converted pFC9 was added. Since these primers are specific for bisulfite converted reagent this was likely a one time contamination or sample mixup. Additionally the bands are faint so this amplification may require more cycles; zymogen suggests 35 to 40 cycles and using a “hot start” Pol.
Before sequencing will re-run reactions using Phusion Pol and with 40 cycles of amplification. Quintara does not recommend sending unpurified PCR products especially with Phusion for sequencing so will use NEB PCR cleanup kit after visualizing on agarose gel.
1/19/22 #
Bisulfite conversion test: PCR for sequencing attempt 2 #
Set up samples as described by table below.
| Sample | Taq Species | Buffer | Forward Primer | Reverse Primer | Template DNA (ul) |
|---|---|---|---|---|---|
| 1 | Lab | NEB 5x HF Taq buffer | pFC9BisP4Rev | pFC9BisP4Rev | 0 |
| 2 | Lab | NEB 5x HF Taq buffer | pFC9BisP4Rev | pFC9BisP4Rev | 0.5 |
| 3 | Phusion | NEB 5x HF Taq buffer | pFC9BisP4Rev | pFC9BisP4Rev | 0 |
| 4 | Phusion | NEB 5x HF Taq buffer | pFC9BisP4Rev | pFC9BisP4Rev | 0.5 |
Master mixes were made using recipe in table below. Before adding Taq master mix was split into 2 aliquots and 2 Taq species tested were added separately. Master mix + Taq aliquots were then split again into individual samples and template DNA was added to samples 2 and 4.
| Reagent | Volume (ul) |
|---|---|
| DNA Pol | 1 |
| DNA Pol buffer | 20 |
| 10 µM Forward Primer | 5 |
| 10 µM Reverse Primer | 5 |
| 10 mM dNTPs | 2 |
| H20 | 65 |
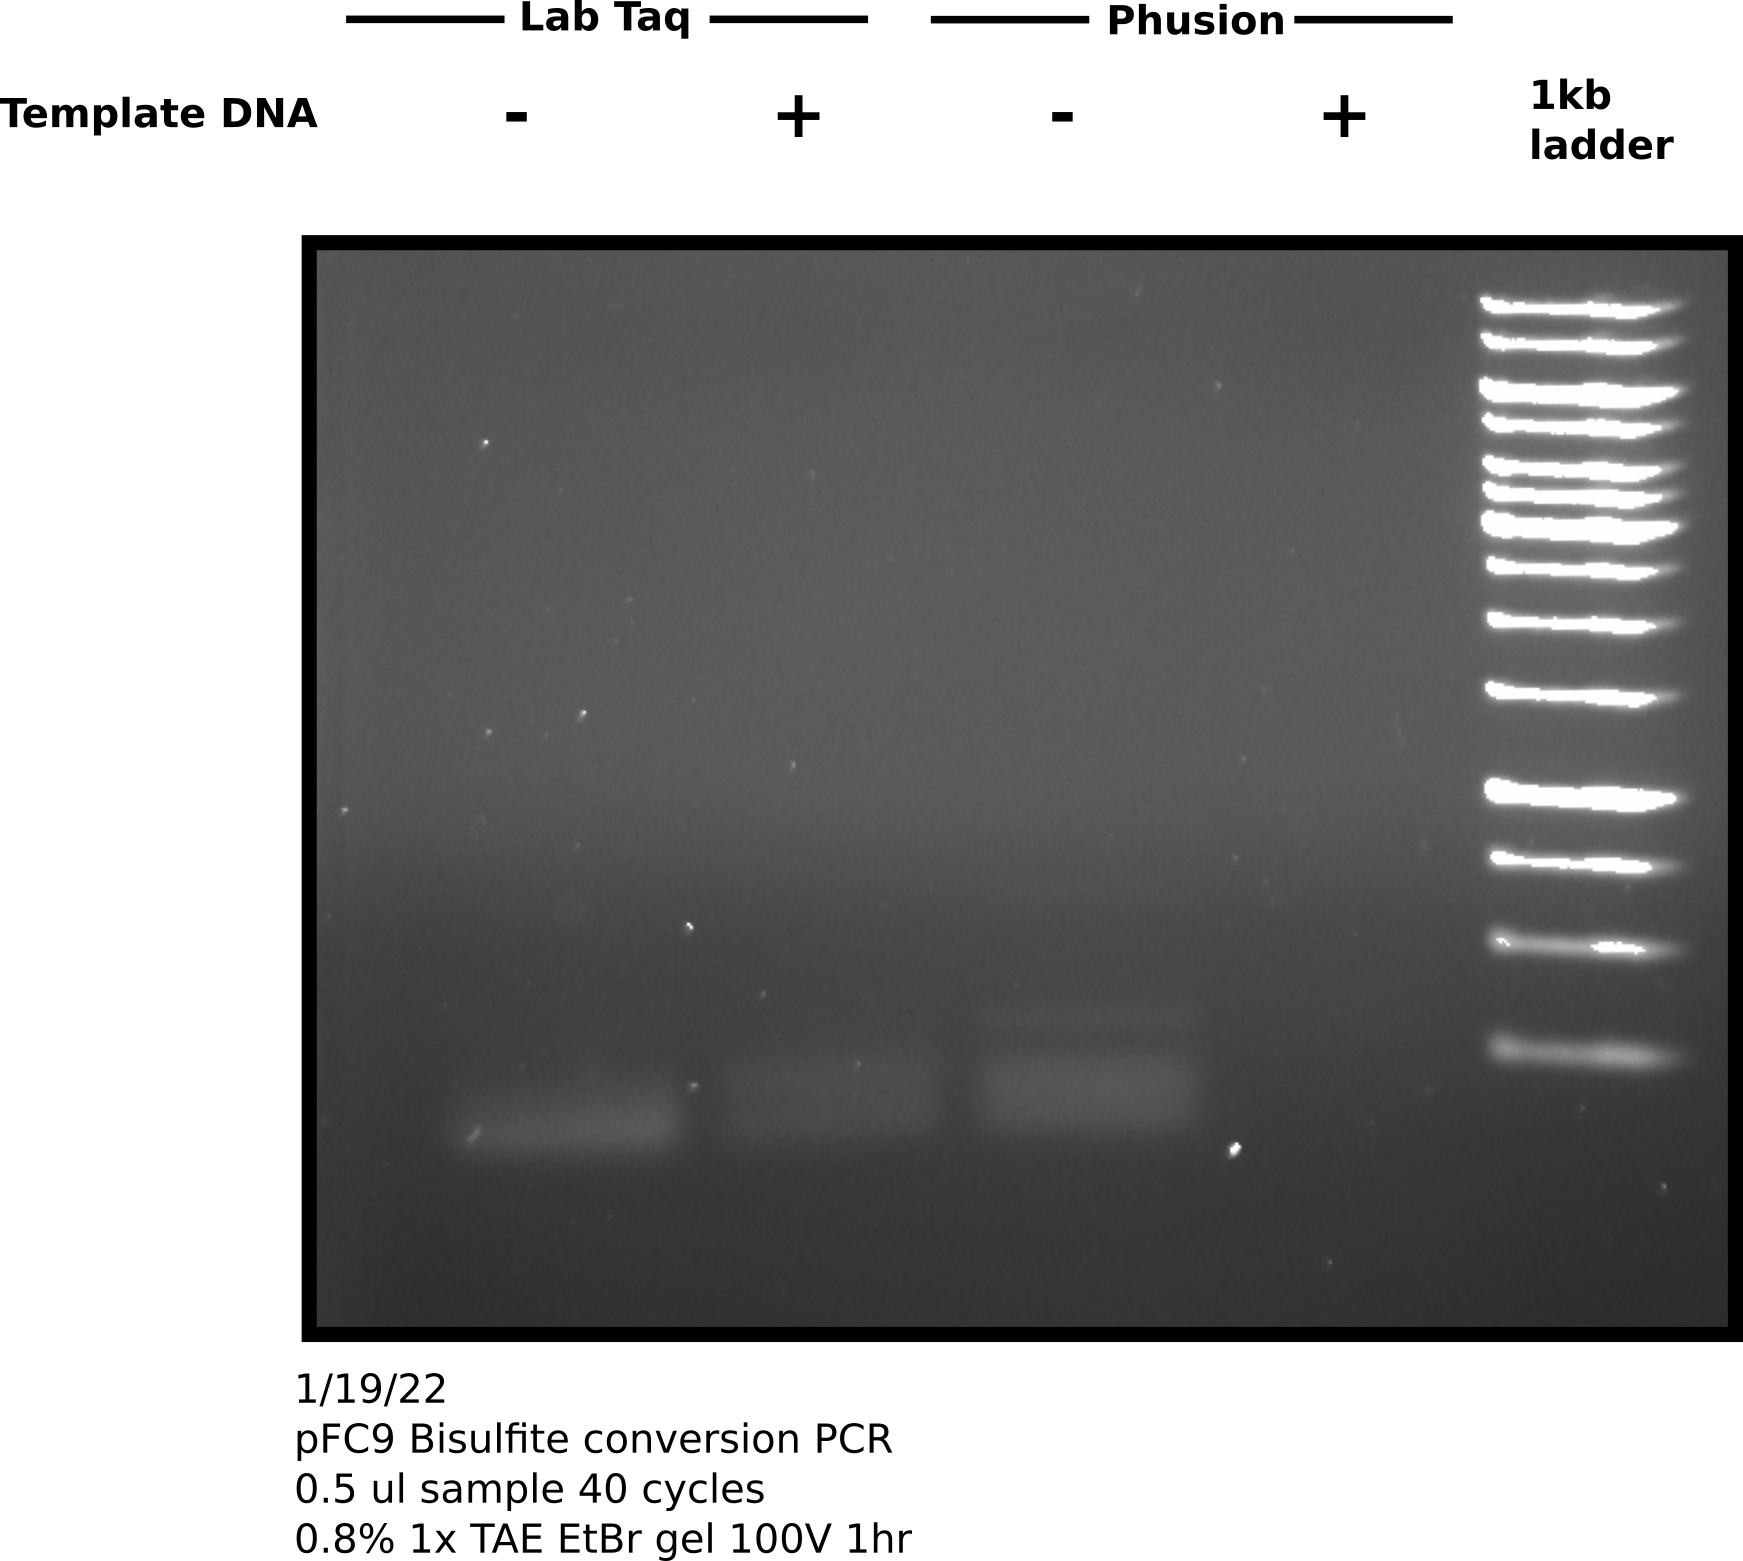
All samples amplified for 40 cycles with annealing temp of 50.5C with 5C gradient.
Direct visualization of bisulfite converted products on agarose gel #
To try and test if my sample actually contains DNA I ran the remaining sample on an agarose gel, following the suggestions provided by Zymogen for visualization of bisulfite converted DNA namely using a high percentage gel and chilling the gel before imaging. However, I think Zymogen assumes the use of genomic DNA for visualization.
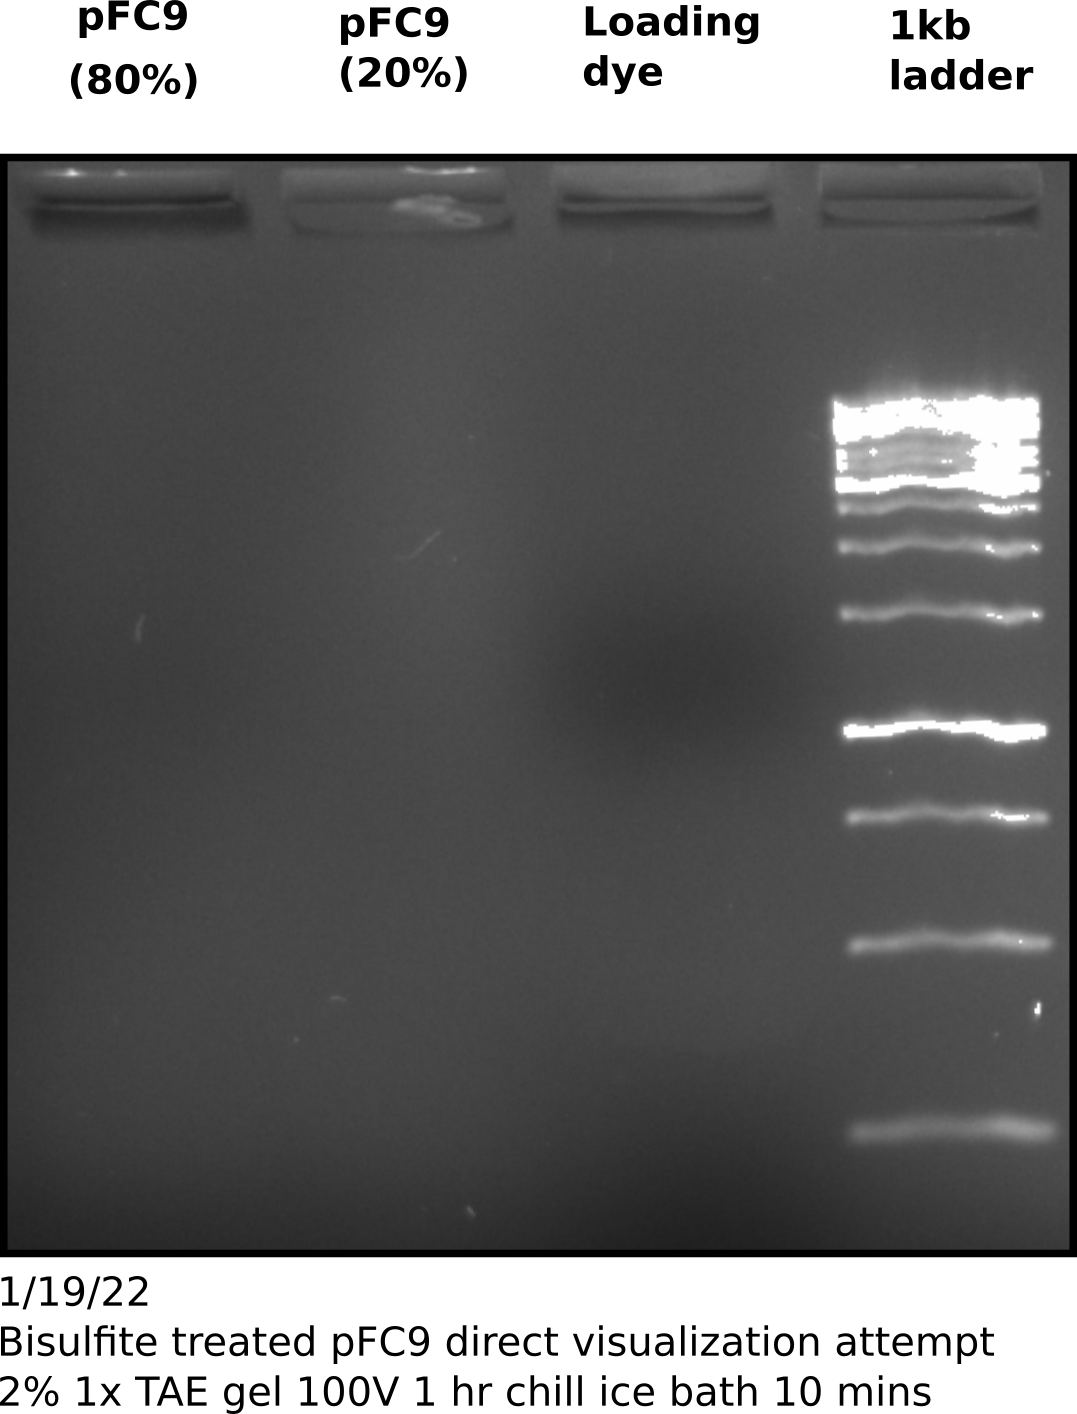
Repeat pFC9 denaturing bisulfite conversion and PCR amplification #
Since nothing can be seen on the gel I repeated denaturing bisulfite conversion protocol using pFC9 following Zymogen protocol as provided using recently purchased lightening reagent. During bisulfite incubation period I re-make PCR reactions just as I did ealier today and kept reactions on ice until I completed the bisulfite conversion protocol. After eluting DNA I added 1 ul of the converted template DNA to the template containing reactions (sample 2 and 4) and started same PCR protocol used earlier today. I saved the remaining 8 ul of sample at -20C in the freezer. After completing 40 PCR cycles I ran 5 ul of each sample (increased sample volume 5x compared to last gel to make sure I would see any faint bands).
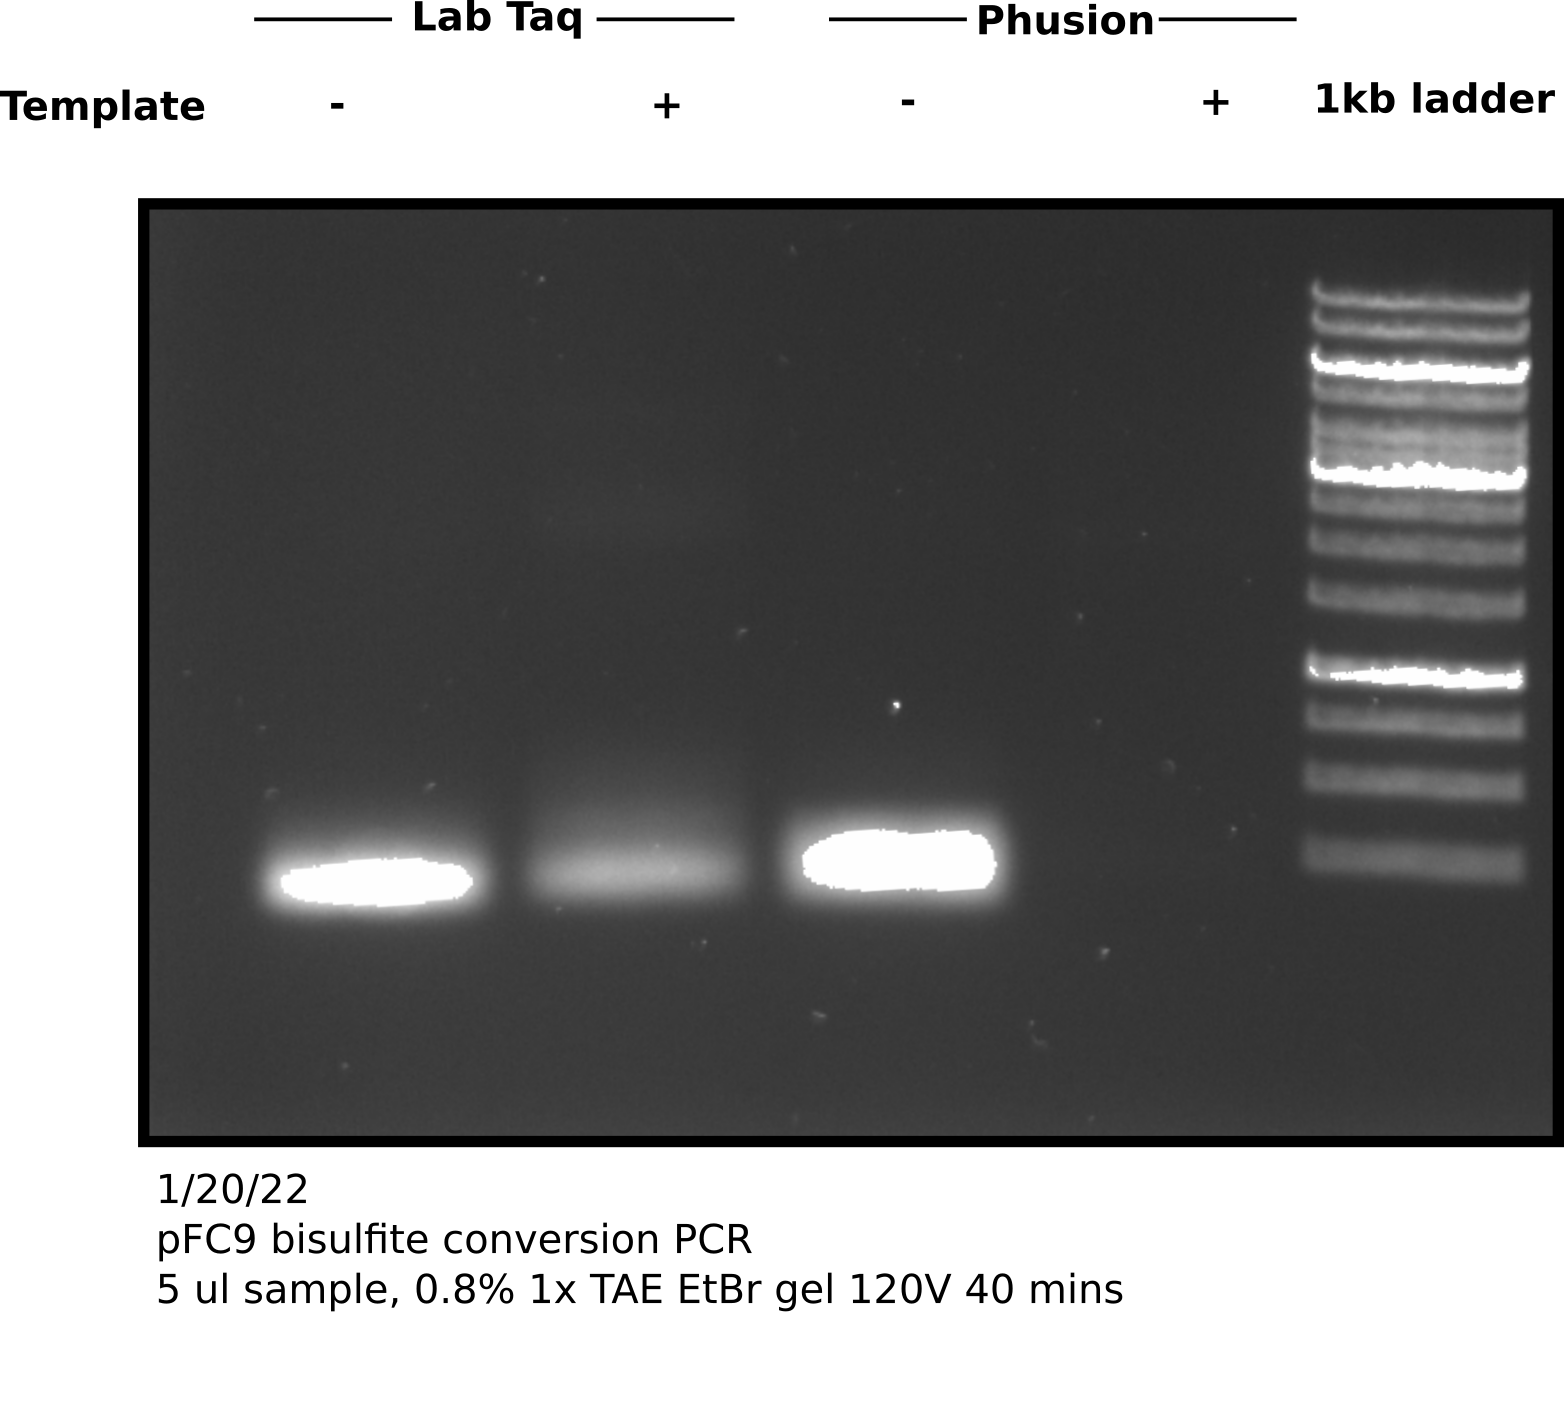
This gel looks almost exactly the same as the one I ran earlier today. This leads me to ask a couple questions about this reaction
- If the bands that are present are primer-dimer, then why is this dimer band not produced when using Phusion + template DNA?
- How can it be determined if amplification (Pol) is not working, primers are bad or if DNA is not converted?
- Is direct visualization of bisulfite converted plasmid DNA actually a viable QC method or is this really only practical for genomic DNA samples.
After meeting with Fred he let me know that PhusionU polymerase seems to be very important for amplifying bisulfite converted sequences. Ordered it and should be arriving sometime this of next week.
1/28/22 #
pFC9 denaturing bisulfite conversion PCR amplification with PhusionU #
Received PhusionU polymerase (lot number 01167009) and setup PCR reactions
according to the tables below or at this link.
PCR setup
Samples
| Sample | Sample volume (ul) | Rxn Volume (ul) | Fwd primer (10 uM) | Rev Primer (10 uM) | Master Mix volume | Master mix |
|---|---|---|---|---|---|---|
| 1 | 1 | 20 | pFC9BisP3Fwd | pFC9BisP4Rev | 19 | 1 |
| 2 | 0 | 20 | pFC9BisP3Fwd | pFC9BisP4Rev | 20 | 1 |
| 3 | 1 | 20 | pFC9BisP3Fwd | pFC9BisP4Rev | 19 | 2 |
| 4 | 0 | 20 | pFC9BisP3Fwd | pFC9BisP4Rev | 20 | 2 |
Master mixes
| Master Mix Number | Volume npH20 (ul) | Fwd Primer | Rev Primer | dNTPs (10 uM) | dNTP Source | PhusionU Polymerase |
|---|---|---|---|---|---|---|
| 1 | 44 | 2.2 | 2.2 | 2.2 | Ethan | 0.44 |
| 2 | 44 | 2.2 | 2.2 | 2.2 | Meghan | 0.44 |
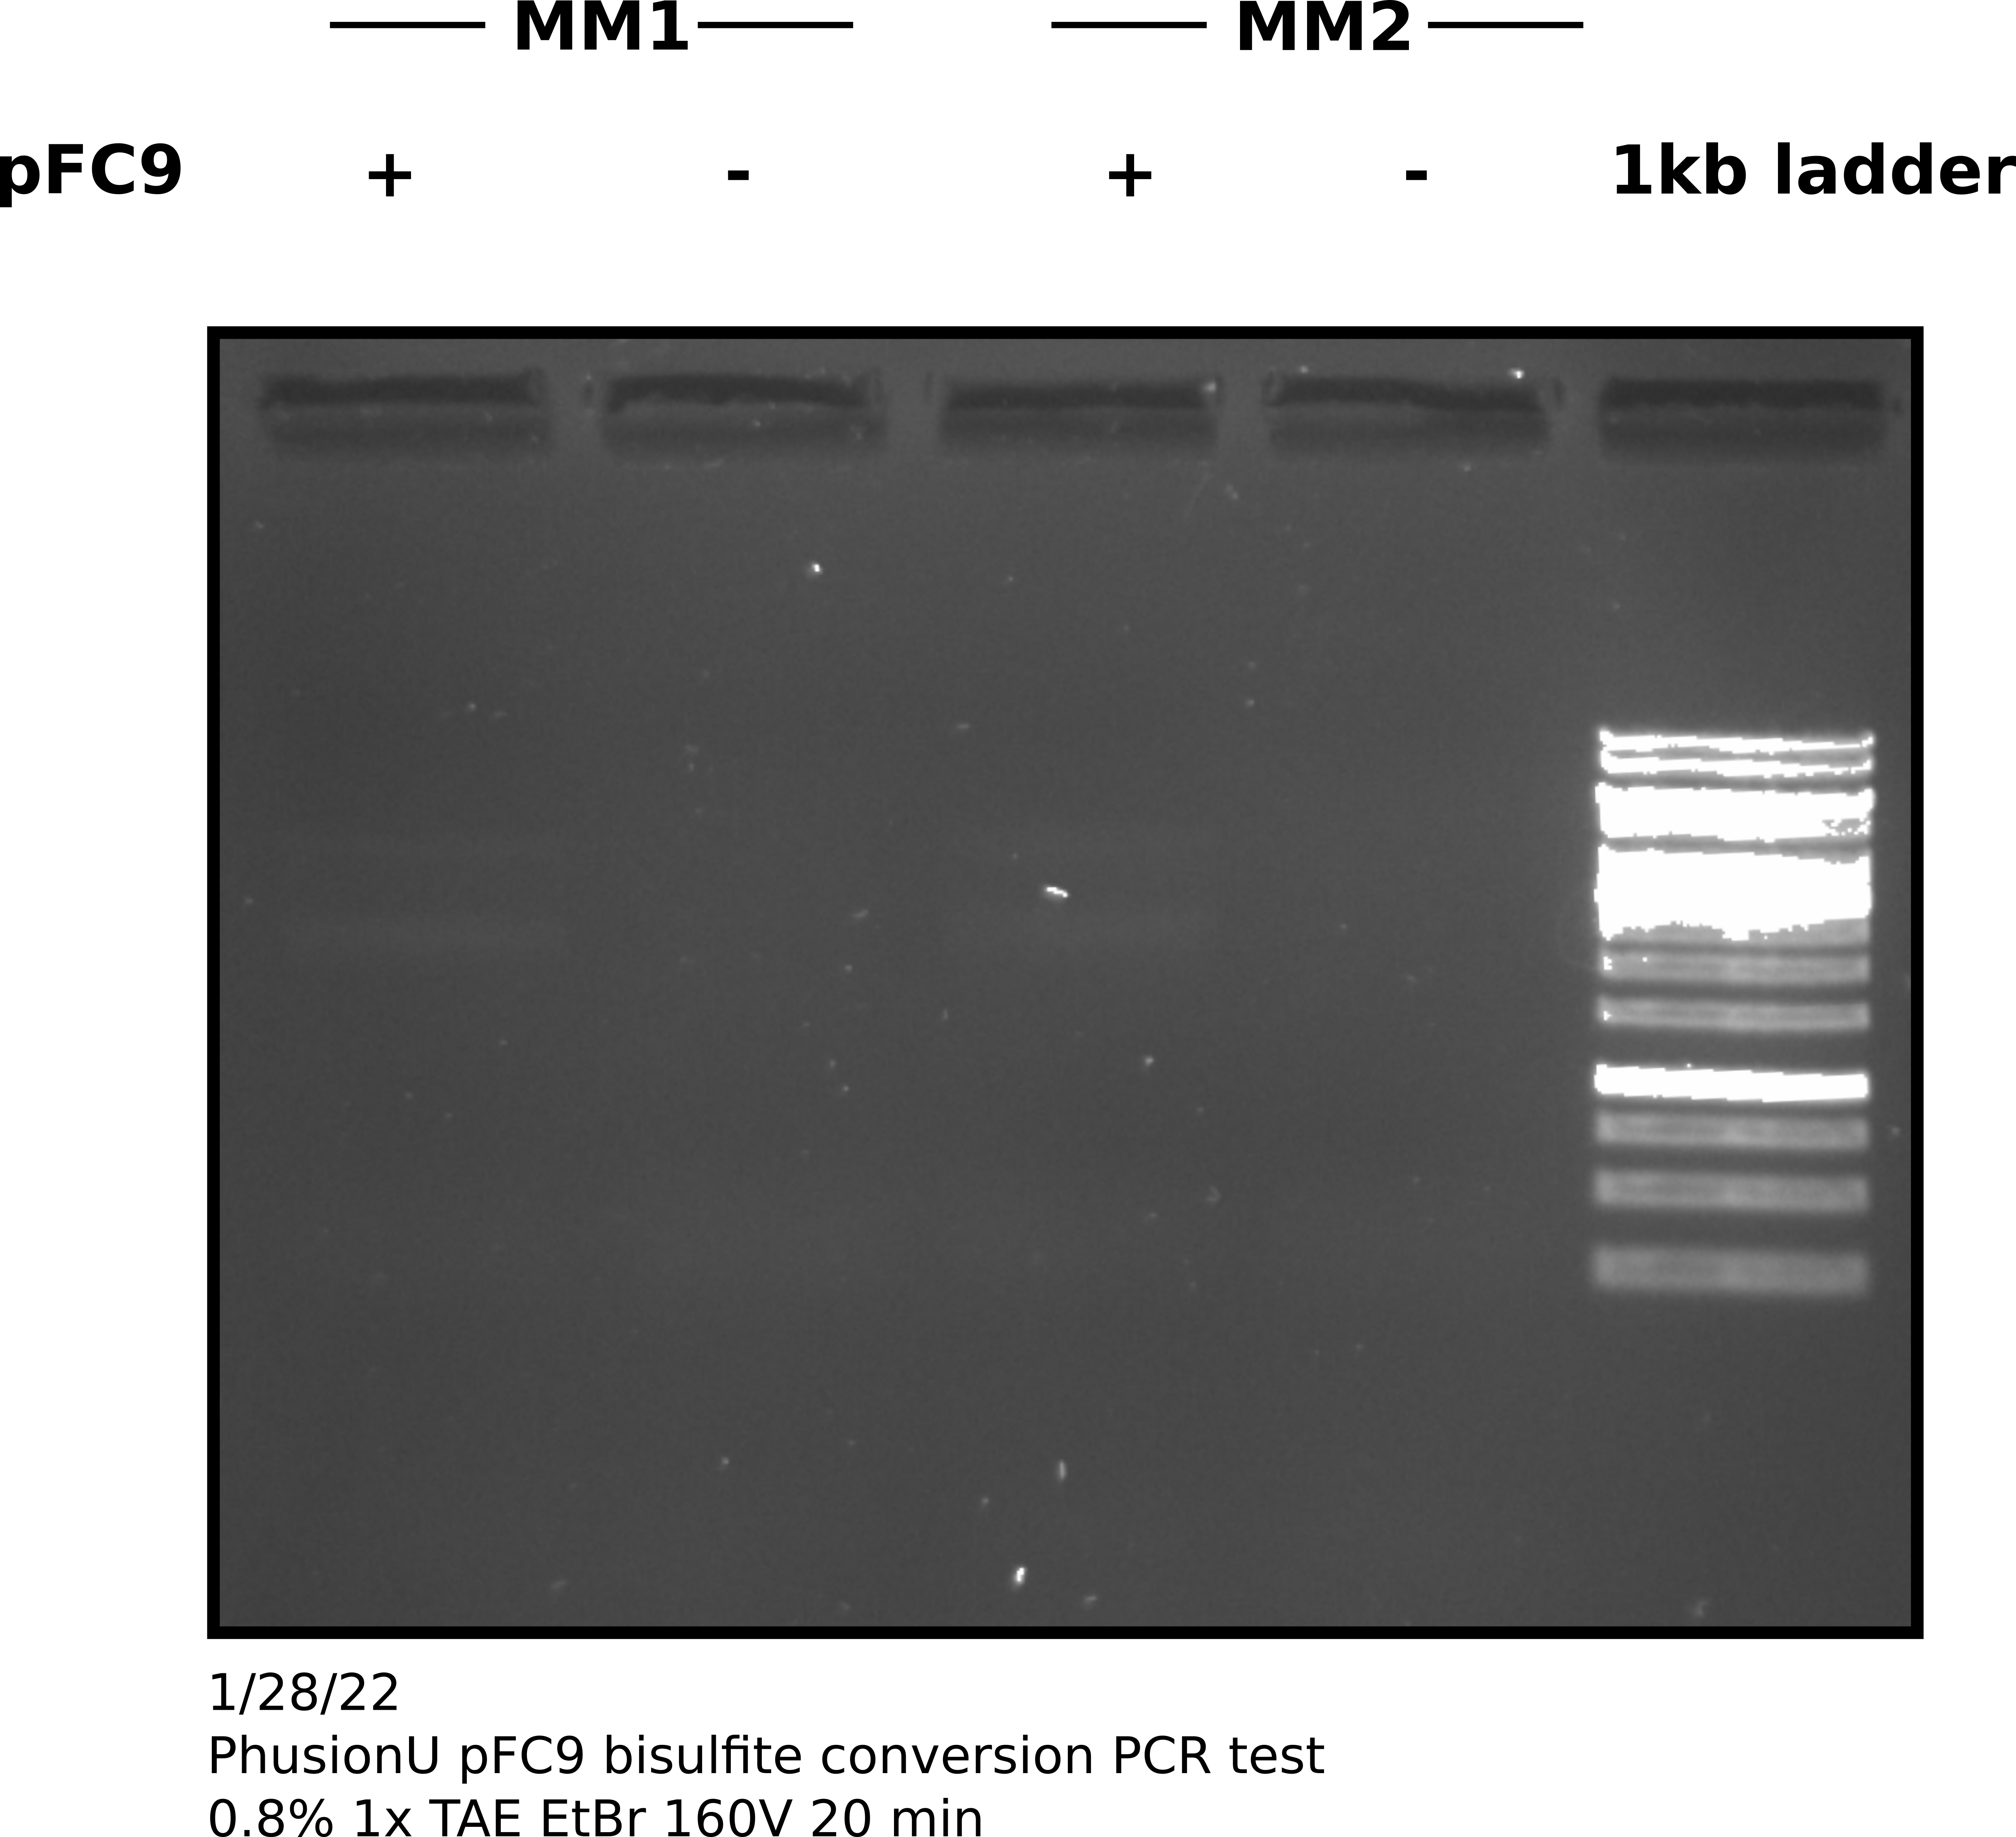
I choose to use two different mixes of dNTPs as Tadas has been having some issues getting amplification even with reliable positive controls and dNTPs where one reagent that has not yet been tested. I ran the PCR for 34 cycles with 60C annealing temp. After completing the protocol I ran 4 ul of products out on agarose gel. All samples amplified in block A of the thermocycler.
PhuU bisulfite treated pFC9 gel #
1/31/22 #
PhuU positive controls #
Since PhuU bisulfite converted pFC9 PCR failed to amplify I ran a couple positive (and coresonding negative control) PCR reactions using PhusionU polymerase and its supplied 5x HF buffer. The reactions are described in the tables below or at this link. Reactions were prepared in the TC hood with filter tips and by splitting reactions when possible.
These reactions were setup at 2 PM on the 30th. PCR reaction began at around 2:45 PM and then was held at 8C until 9:OO AM the next day.
PCR setup
Sample details
| Sample Number | Template | Fwd Primer | Rev Primer | Buffer | Taq | Reaction volume (ul) | Master Mix | Volume Master mix (ul) | Volume fwd primer | Volume rev primer | Template Volume | Volume loaded (gel) | Gel Lane | Voltage | Time (mins) | Anneal temp | Cycles | Block | |||||||
|---|---|---|---|---|---|---|---|---|---|---|---|---|---|---|---|---|---|---|---|---|---|---|---|---|---|
| 1 | T7 Init Mix | VRI_primer_1 | VRI_primer_2 | PhusionU 5x HF | PhusionU | 25 | 1 | 23 | 0.5 | 0.5 | 1 | 5 | 1 | 60 | 120 | 58.3 | 34 | A | |||||||
| 2 | T7 Init Mix | tac_init_fwd_primer | tac_init_rev_primer | PhusionU 5x HF | PhusionU | 25 | 1 | 23 | 0.5 | 0.5 | 1 | 5 | 2 | 60 | 120 | 58.3 | 34 | A | |||||||
| 3 | VR-1 | VRI_primer_1 | VRI_primer_2 | PhusionU 5x HF | PhusionU | 25 | 1 | 23 | 0.5 | 0.5 | 1 | 5 | 3 | 60 | 58.3 | 34 | A | ||||||||
| 4 | NA | VRI_primer_1 | VRI_primer_2 | PhusionU 5x HF | PhusionU | 25 | 1 | 24 | 0.5 | 0.5 | 0 | 5 | 3 | 58.3 | 34 | A | |||||||||
| 5 | NA | tac_init_fwd_primer | tac_init_rev_primer | PhusionU 5x HF | PhusionU | 25 | 1 | 24 | 0.5 | 0.5 | 0 | 5 | 4 | 58.3 | 34 | A |
Master Mix
| Master Mixes | Taq | Buffer | Total volume | Taq volume (ul) | Buffer Volume | dNTPs (10 uM) | Primers (fwd and reverse) do not add to mix | Template DNA (do not add to mix) | npH20 |
|---|---|---|---|---|---|---|---|---|---|
| 1 | PhusionU | PhusionU 5x HF | 150 | 0.5 | 15 | 3 | 3 | 5 | 123.5 |
Template dilutions
| Templates | Stock (ng/ul) | Target concentration (ng / ul) | Dilution volume (ul) | template volume (ul) | npN20 |
|---|---|---|---|---|---|
| VR-1 | 50 | 1 | 50 | 1 | 49 |
| T7 init mix | 205 | 1 | 50 | 0.243902439 | 49.75609756 |
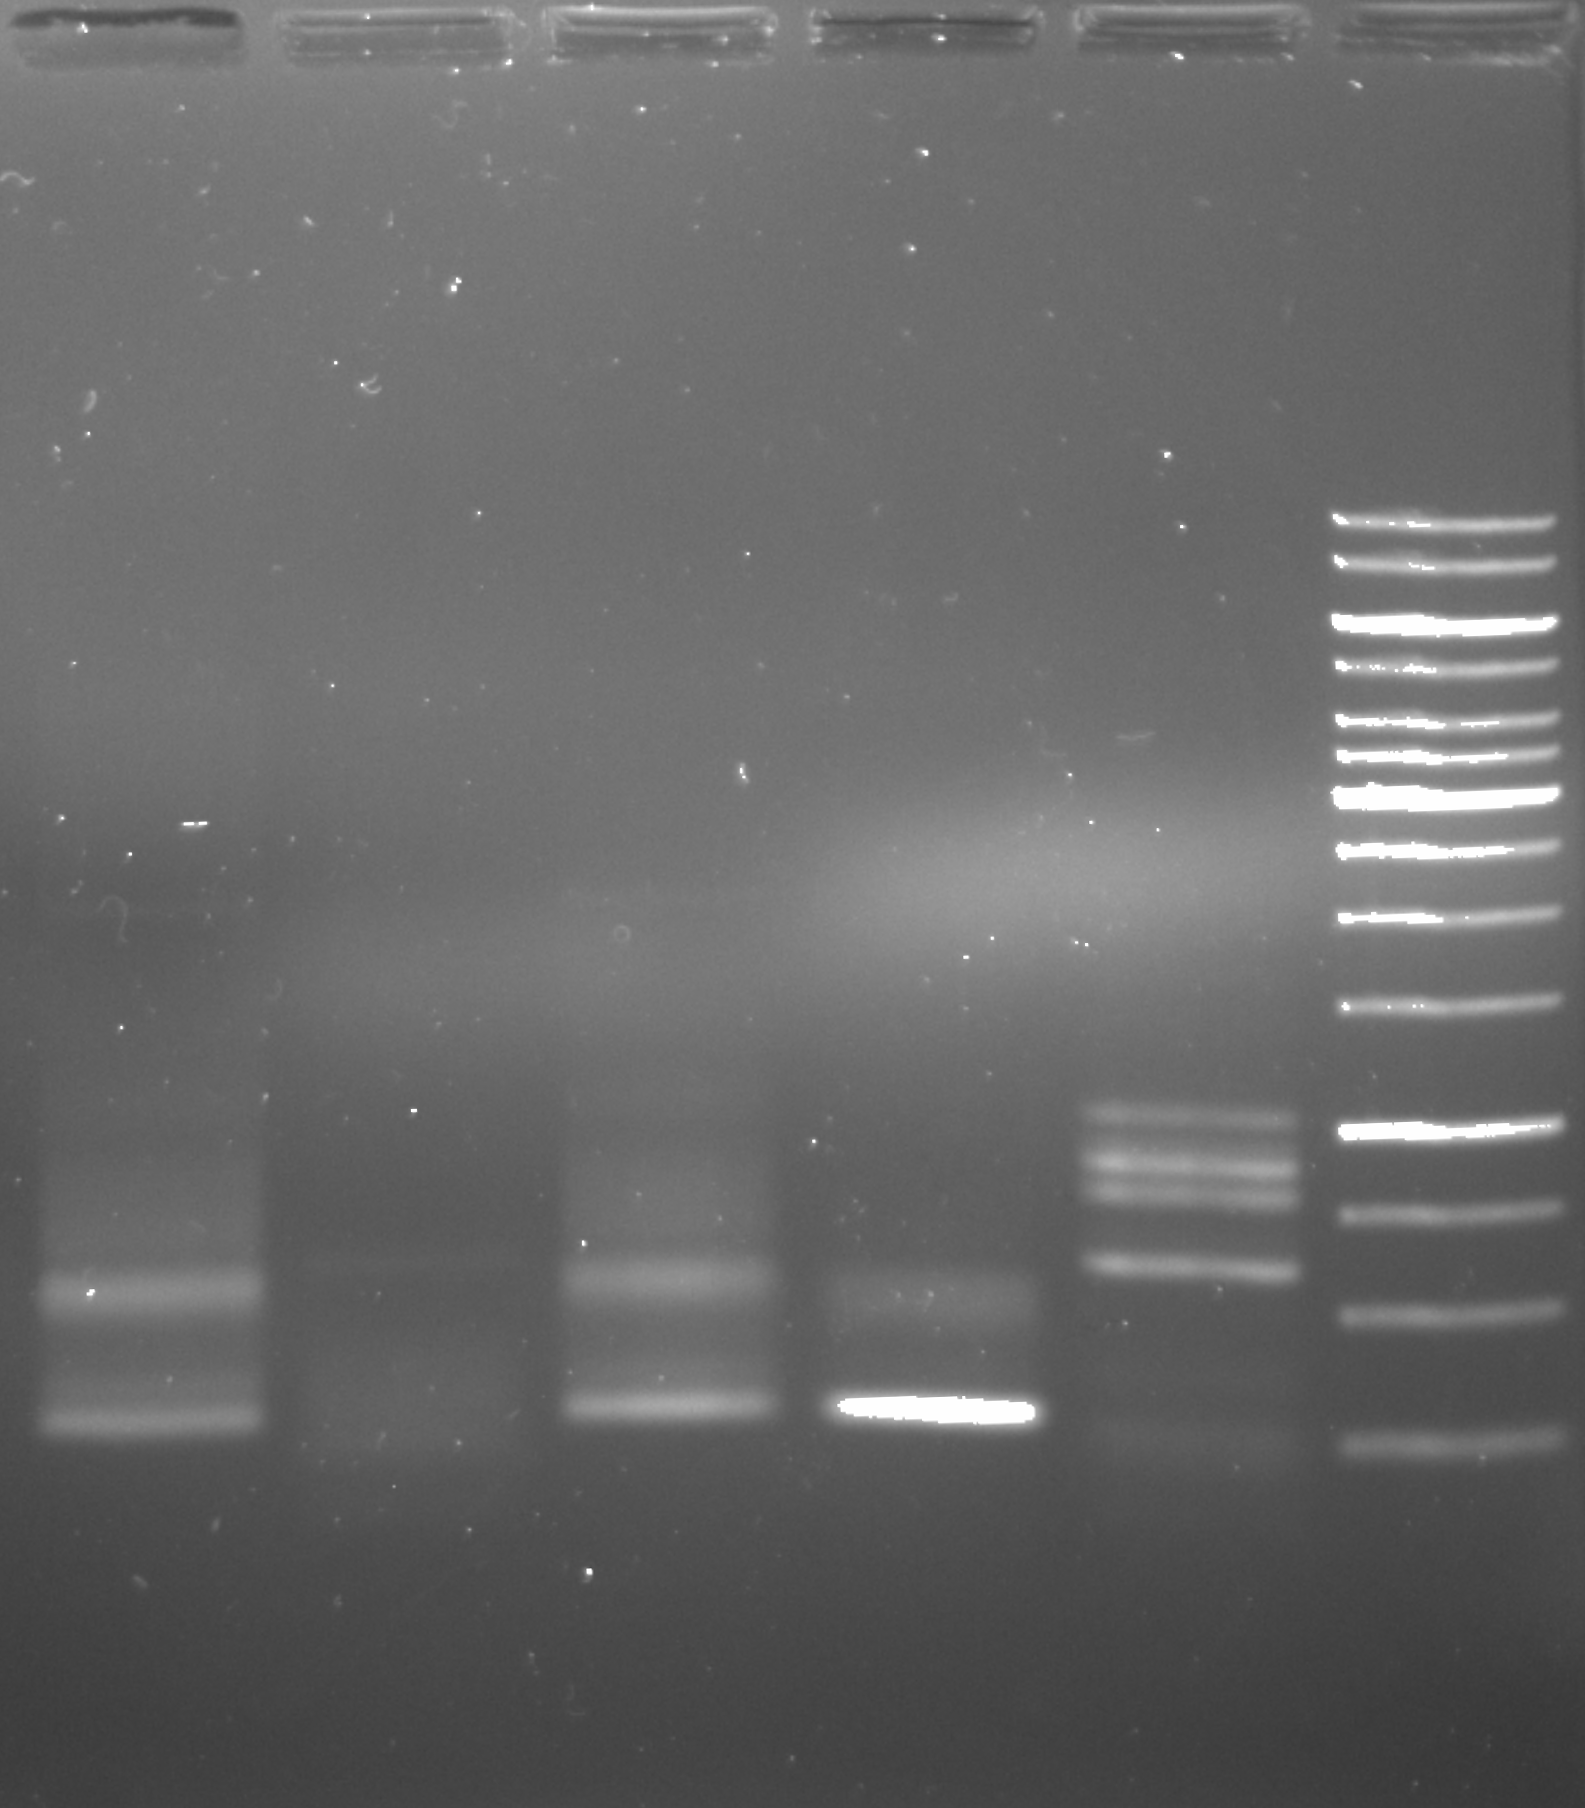
PhusionU PCR positive control gel image 1 #
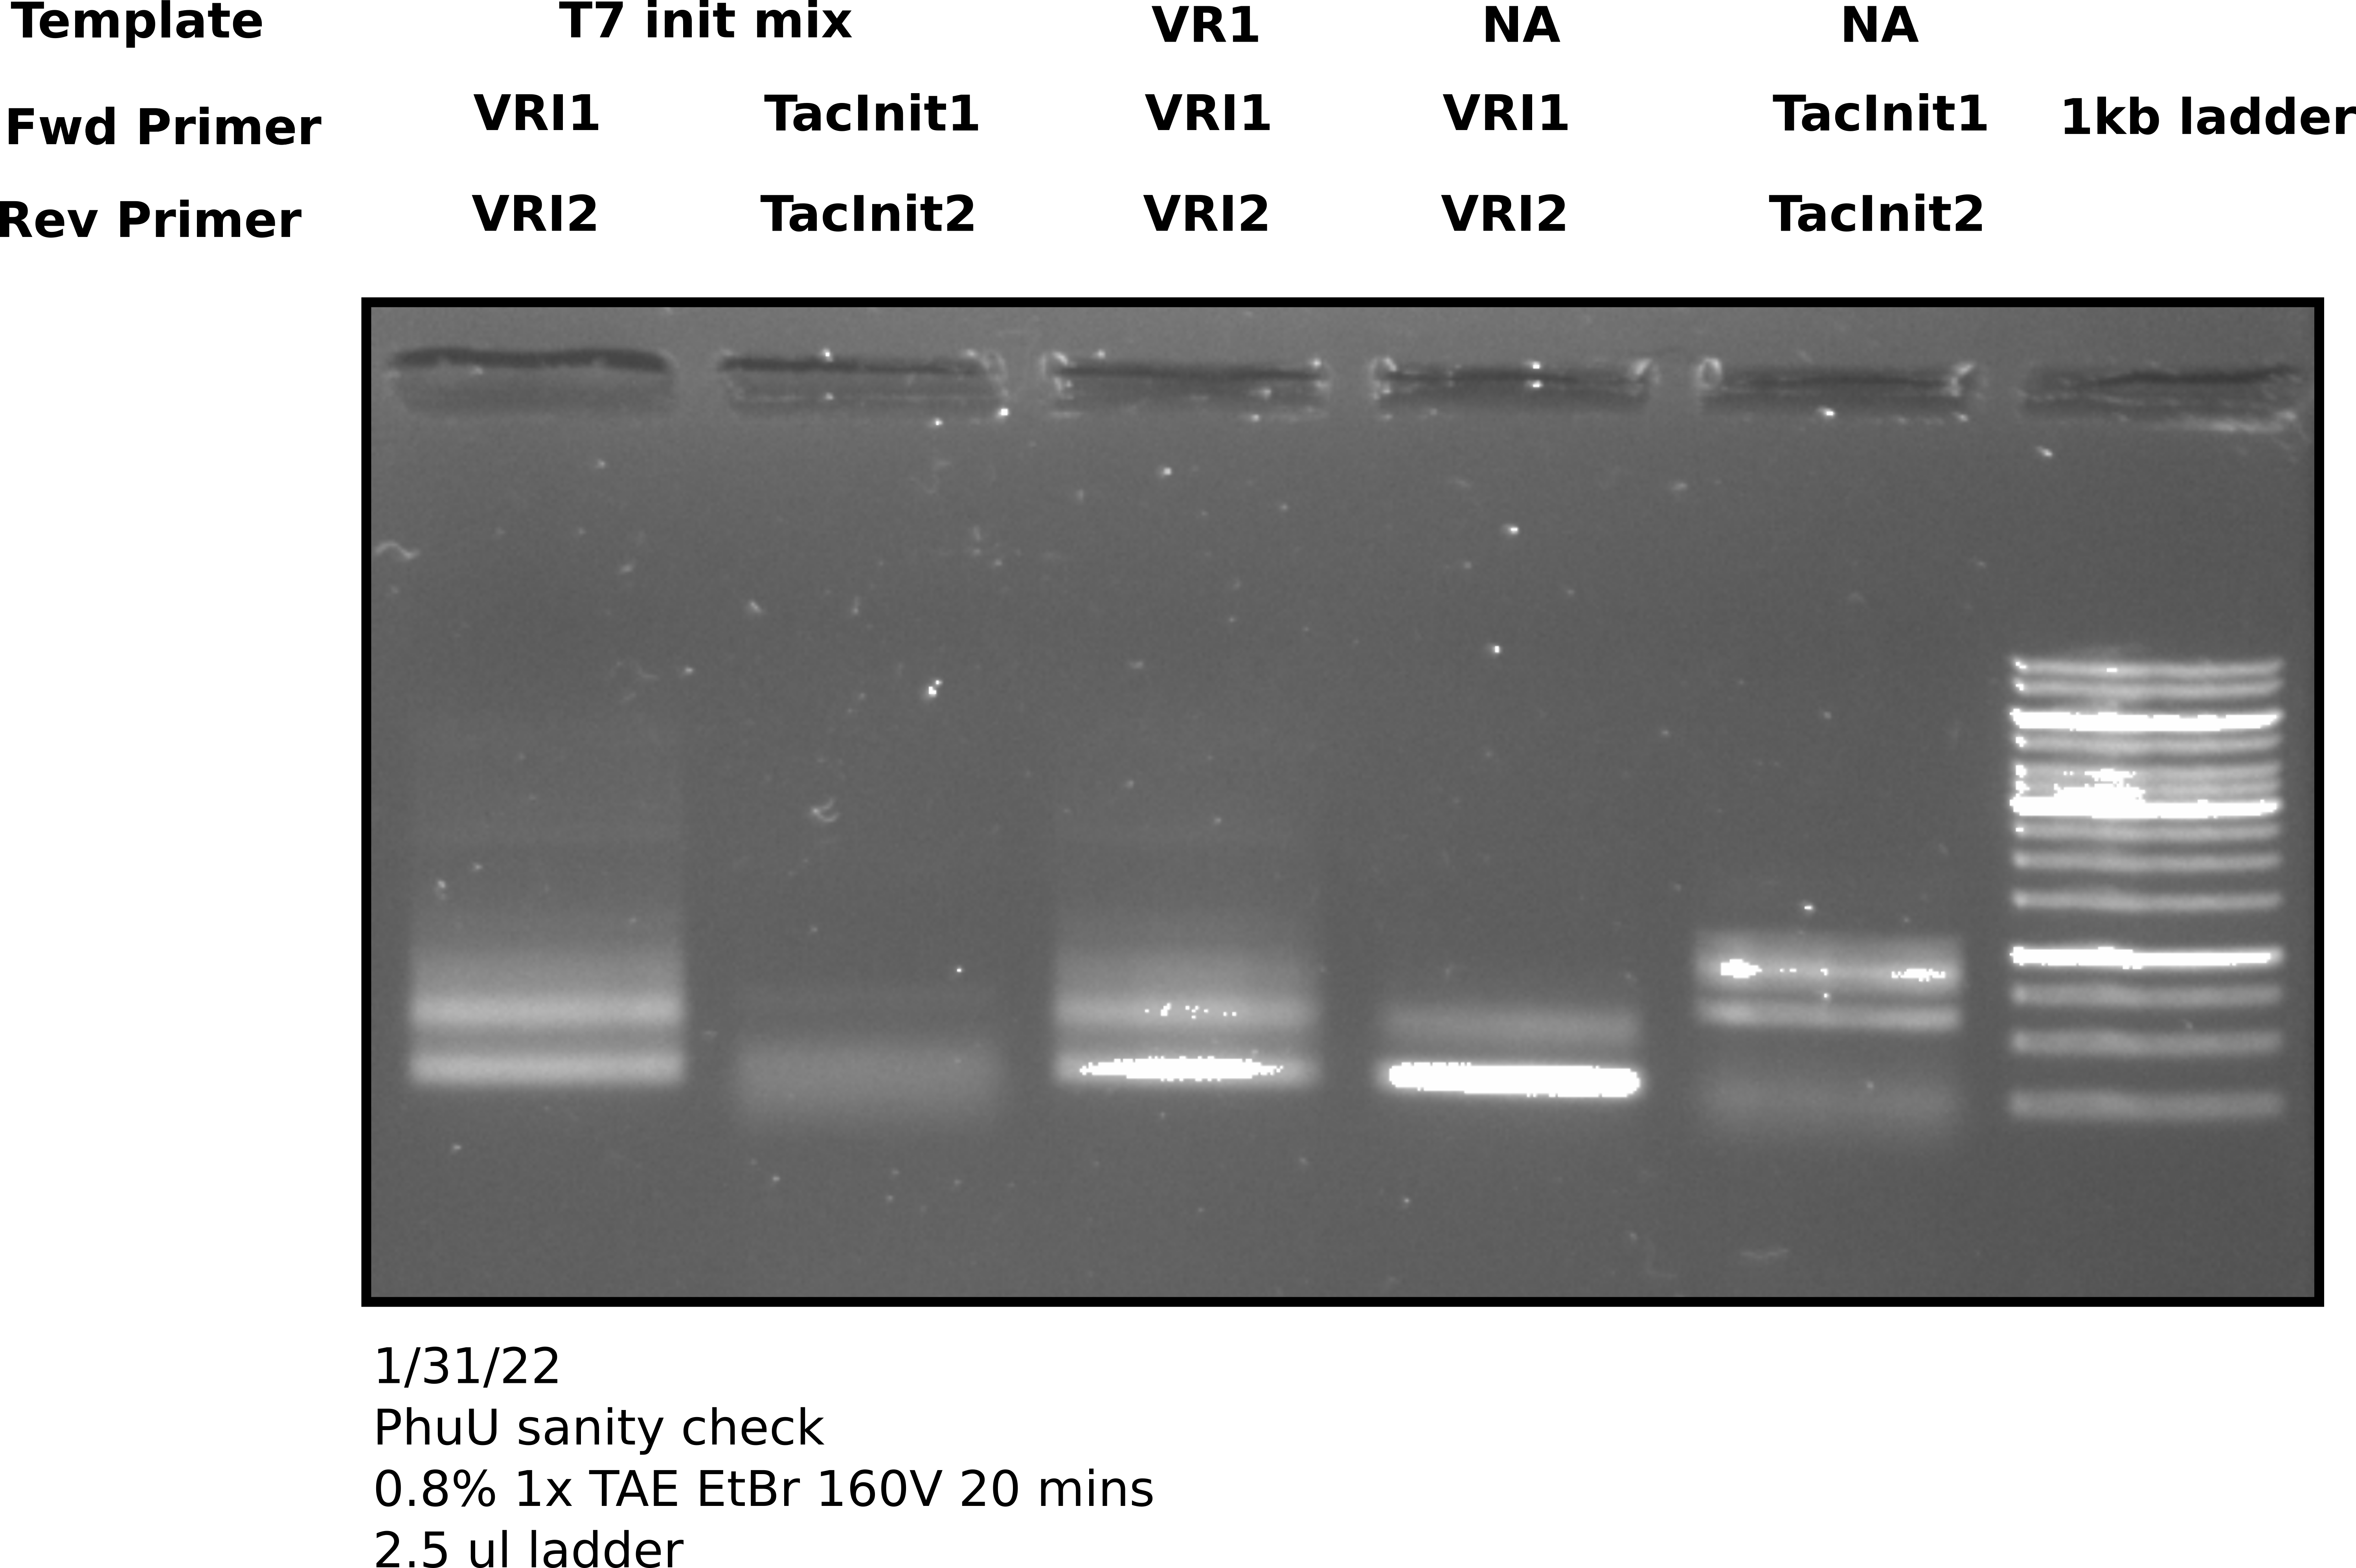
2 ul of sample was used in each lane.
Clearly some sort of amplification is happening. The first note of concern is that the negative controls (lanes 4 and 5) clearly have something going on with them. What is interesting though that they do not appear the same to the corresponding positive controls. That raises the question of what is actually going on in the negatives. Second thing to note is that at this temperature (58.3C) there seems to be non-specific amplification with VRI primers. That isn’t a huge issue as this was just a positive control test to confirm PhuU activity but in the future when using this polymerase it will probably be worth testing temperature gradients to avoid non-specific products. Finally on the upside there does seem to be some amplification of the VR insert mix using the Tac init primers. This amplification produces products for Gibson assembly for the Tac Init series and is a reaction Tada’s has been struggling to get to work. Phusion may be helpful hear and it may be worth running the remaining 23 ul of sample out for agarose gel extraction.
Because of these concerns I continued to run the gel after I initially imaged it at 100V for an additional 50 minutes and then re-imaged. The second image is shown below. Refer to image 1 for gel labels.
2/3/22 #
PhuU polymerase with temp gradient #
While talking to Fred he mentioned that in the past generally very low annealing temperatures have been used when amplifying bisulfite treated samples so I am testing a gradient of annealing temperatures between 40 and 50C with my pFC9 denaturing bisulfite treated sample. Sample and PCR details are available in the table below and at this link.